Chart USD/CAD Update: Leaning lower in USD- and CAD-driven trade
Consolidation following the retest of strong resistance at the 1.4290 Fibonacci retracement and the 1.4300 current year high of 9 October has given way to fresh pullback
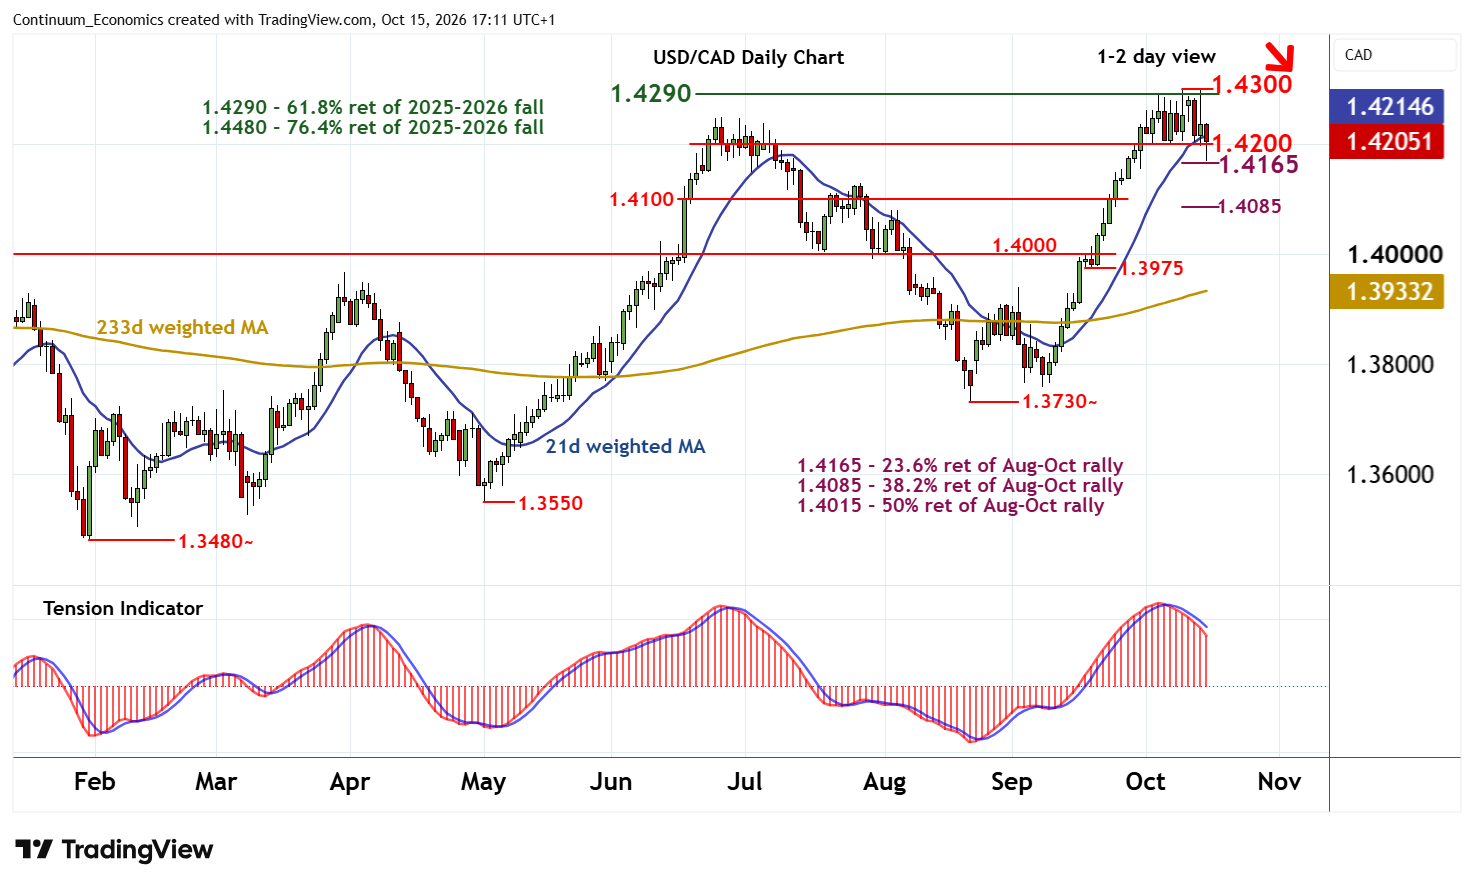
| Levels | Imp | Comment | Levels | Imp | Comment | |||
|---|---|---|---|---|---|---|---|---|
| R4 | 1.4400 | * | congestion | S1 | 1.4200 | ** | congestion | |
| R3 | 1.4350 | * | congestion | S2 | 1.4165 | 23.6% ret of Aug-Oct rally | ||
| R2 | 1.4300 | ** | 9 Oct YTD high | S3 | 1.4100 | minor congestion | ||
| R1 | 1.4290 | ** | 61.8% ret of 2025-2026 fall | S4 | 1.4085 | ** | 38.2% ret of Aug-Oct rally |
Asterisk denotes strength of level
16:55 BST - Consolidation following the retest of strong resistance at the 1.4290 Fibonacci retracement and the 1.4300 current year high of 9 October has given way to fresh pullback in both USD- and CAD-driven trade. Selling interest has reached the 1.4165 Fibonacci retracement, before settling into consolidation above congestion support at 1.4200. Daily studies have turned down, highlighting room for further losses in the coming sessions. However, rising weekly charts should limit any immediate break below 1.4165 in consolidation above strong support within the 1.4085 - 1.4100 range.
Meanwhile, resistance remains at 1.4290 - 1.4300. A close above here, not yet seen, will turn sentiment positive and extend broad January gains towards congestion around 1.4350.