Published: 2026-09-24T06:33:47.000Z
Chart AUD/NZD Update: Leaning lower from 1.2490 multi-year high
3
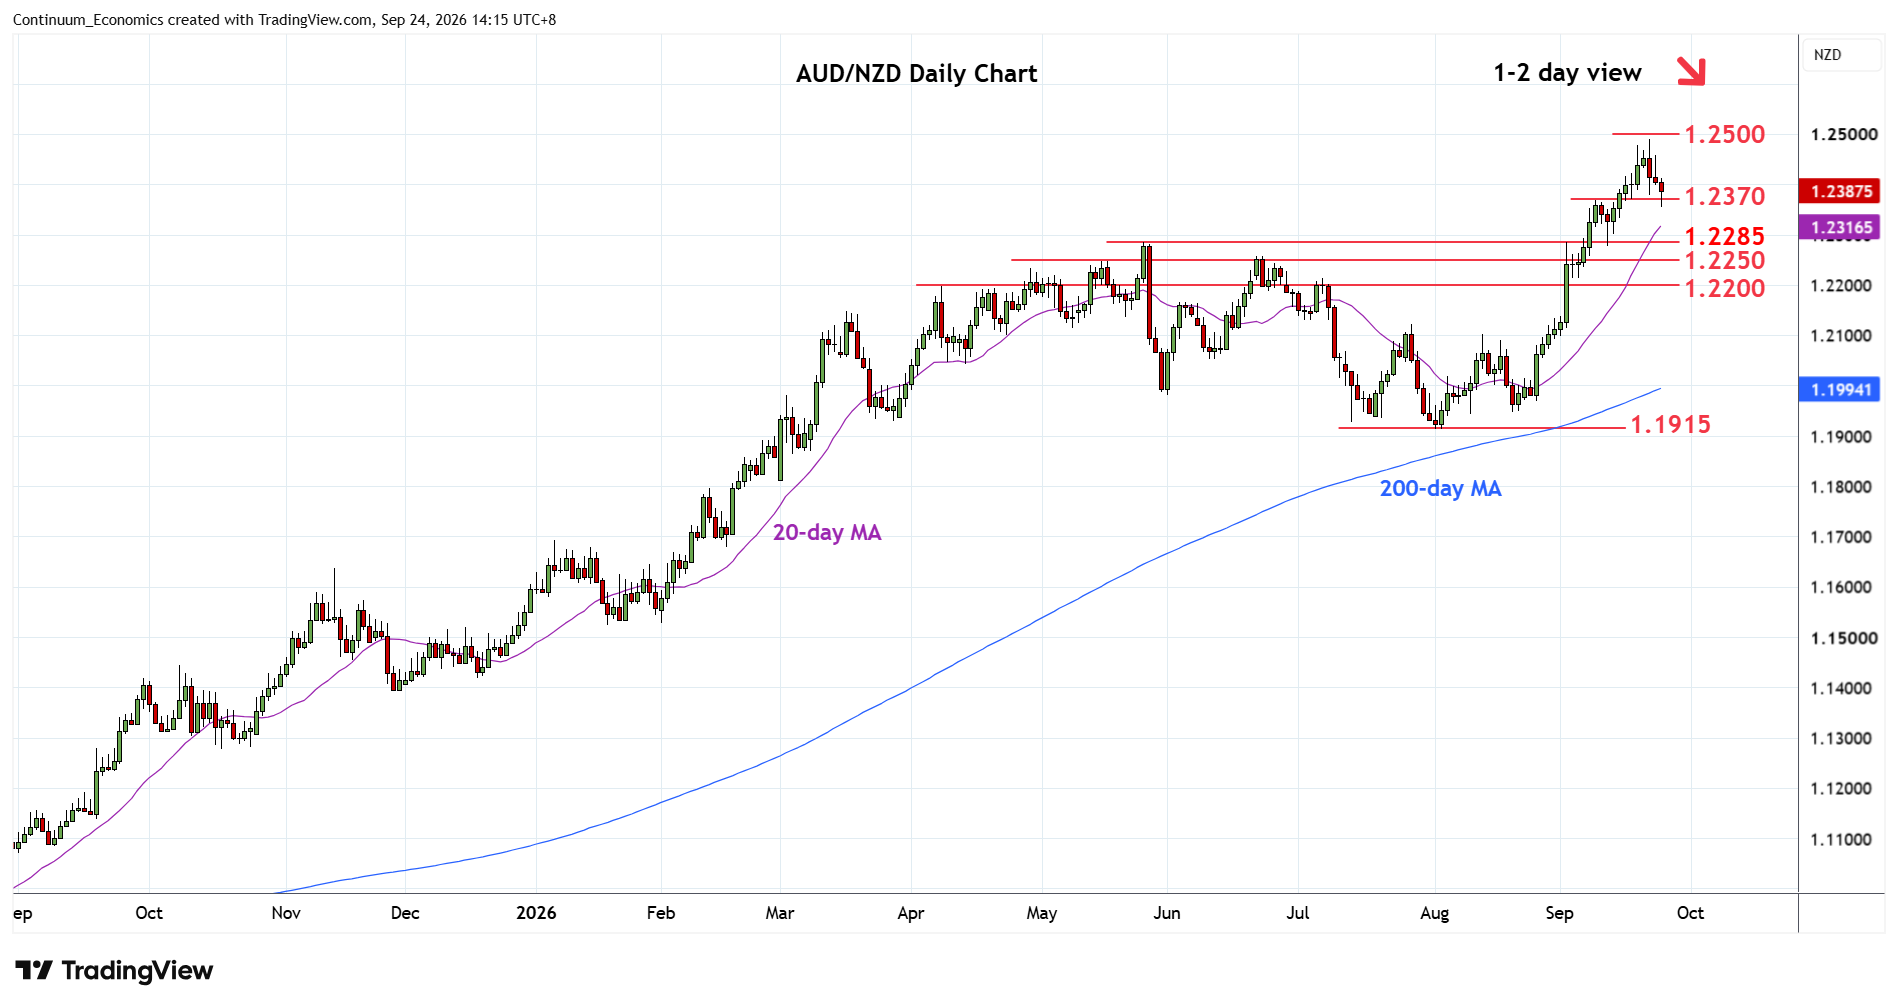
Consolidating test of support at the 1.2400/1.2370 area and scope seen for break here to extend losses from the 1.2490 high
| Level | Comment | Level | Comment | |||||
|---|---|---|---|---|---|---|---|---|
| R4 | 1.2600 | * | congestion | S1 | 1.2370 | * | 9 Sep high | |
| R3 | 1.2550 | * | congestion | S2 | 1.2285 | ** | May high | |
| R2 | 1.2500 | ** | congestion | S3 | 1.2250 | * | congestion | |
| R1 | 1.2490 | ** | 22 Sep YTD high | S4 | 1.2200 | * | congestion |
Asterisk denotes strength of level
06:30 GMT - Consolidating test of support at the 1.2400/1.2370 area and scope seen for break here to extend losses from the 1.2490 high. Daily studies have turned lower to unwind overbought readings and suggest scope for break to see room for deeper pulllback to retrace strong gains from the 1.1915 August low. Break will see extension towards support at the 1.2285 May high and the 1.2250/1.2200 congestion area. Meanwhile, resistance at the 1.2490/1.2500 high and congestion expected to cap. Clearance, if seen, will extend the underlying bull trend from the 2020 year low.