Chart USD/CAD Update: Consolidating recent gains
The anticipated test above congestion resistance at 1.3900 has not been seen
| Levels | Imp | Comment | Levels | Imp | Comment | |||
|---|---|---|---|---|---|---|---|---|
| R4 | 1.4050 | congestion | S1 | 1.3800 | ** | congestion | ||
| R3 | 1.4000 | ** | break level | S2 | 1.3730~ | * | 21 Aug (w) low | |
| R2 | 1.3950 | congestion | S3 | 1.3715 | ** | 76.4% ret of May-Jun rally | ||
| R1 | 1.3900 | * | congestion | S4 | 1.3700 | ** | congestion |
Asterisk denotes strength of level
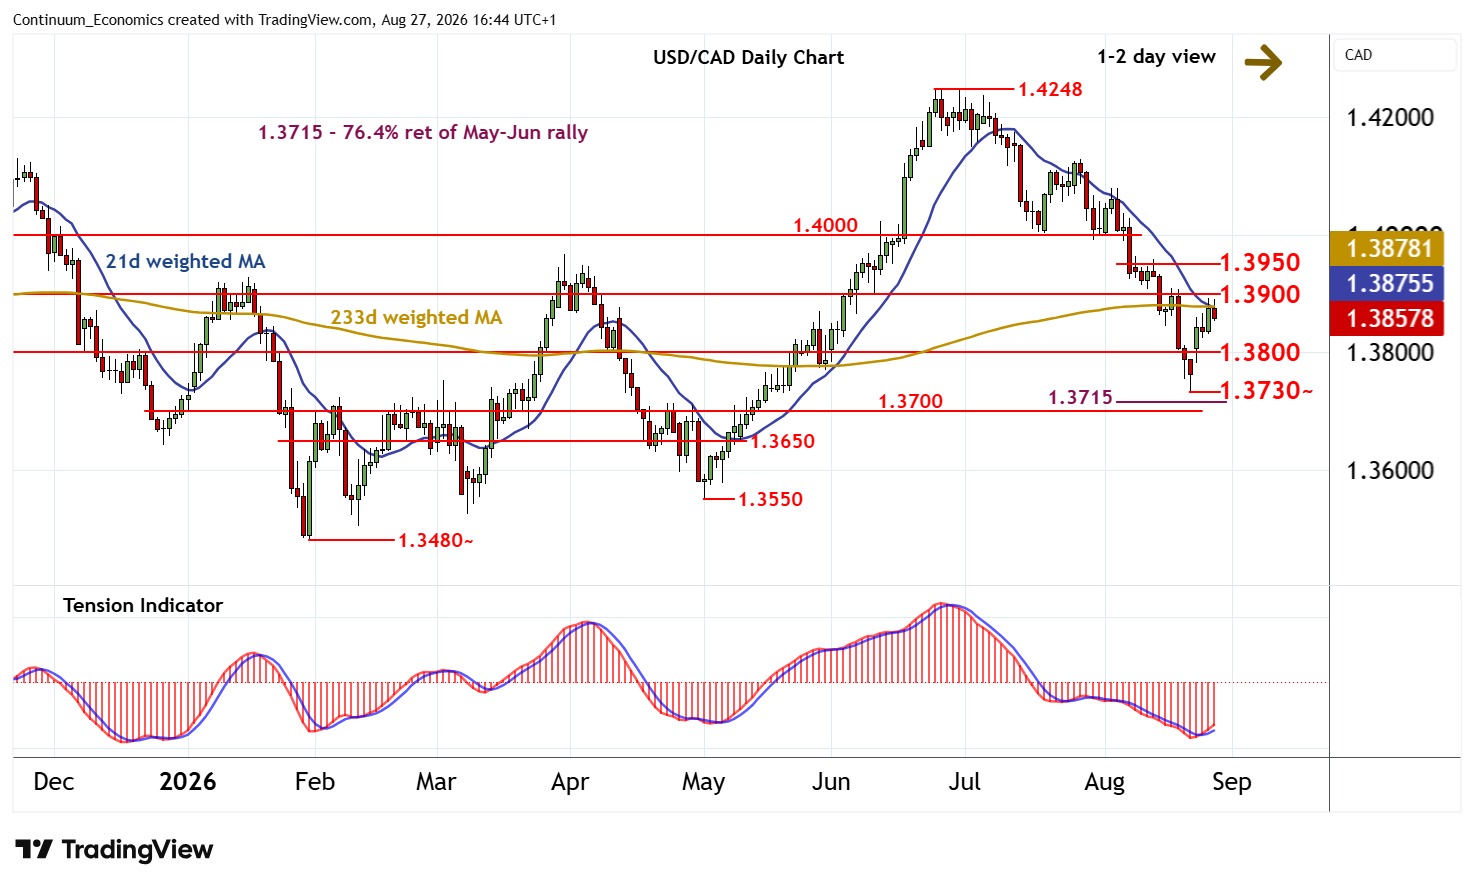
16:30 BST - The anticipated test above congestion resistance at 1.3900 has not been seen, as consolidation beneath here gives way to a pullback as overbought intraday studies unwind. Daily stochastics and the daily Tension Indicator continue to rise, suggesting limited downside tests, with prices to settle into consolidation above congestion support at 1.3800, before bearish weekly charts prompt further losses. A break, not yet seen, will add weight to sentiment and extend losses towards strong support at the 1.3730~ weekly low of 21 August.
Meanwhile, any immediate tests above 1.3900 should meet renewed selling interest beneath further congestion around 1.3950.