Chartbook: UK Chart FTSE 100 Update: Cautious trade - gains to remain limited
The anticipated break below support at 10,000 posted a fresh year low at 9670, (just above the 9650 Fibonacci retracement), before bouncing back into consolidation, supported around 10,150.
The anticipated break below support at 10,000 posted a fresh year low at 9670, (just above the 9650 Fibonacci retracement), before bouncing back into consolidation, supported around 10,150.
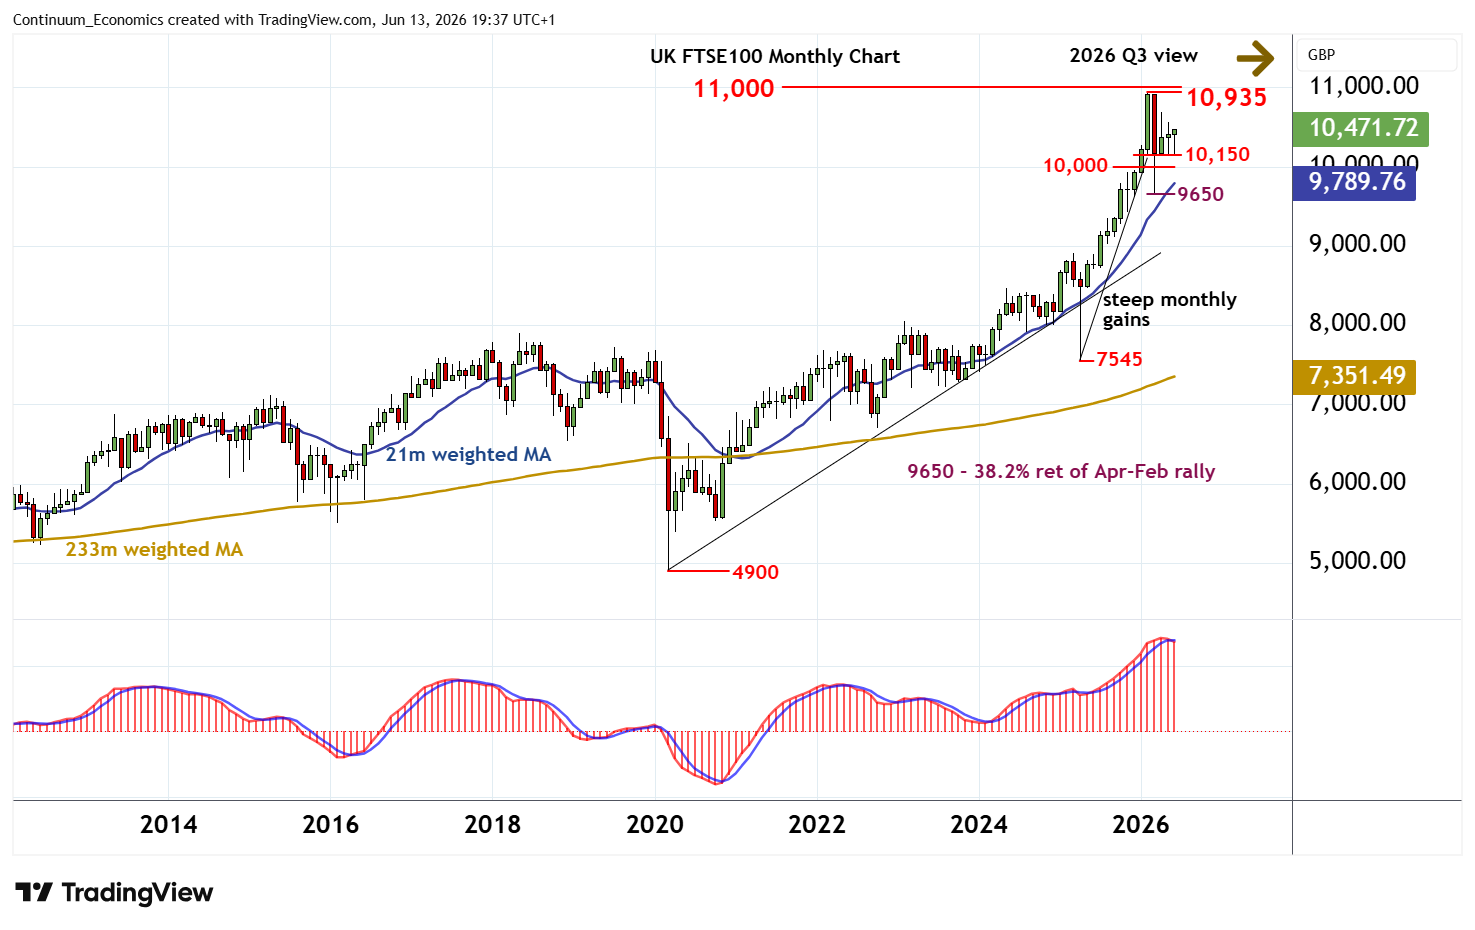
Negative monthly stochastics are flattening, suggesting a minor improvement in sentiment and room for a test higher into early 2026 Q3.
But the deteriorating monthly Tension Indicator and mixed longer-term charts should limit initial scope in renewed consolidation beneath critical resistance at the 10,935 current all-time high of 27 February and psychological barrier at 11,000.
A close above here, however, would turn sentiment positive once and confirm continuation of multi-year bull trends into fresh all-time highs.
Meanwhile, support is at range lows around 10,150 and extends to 10,000.
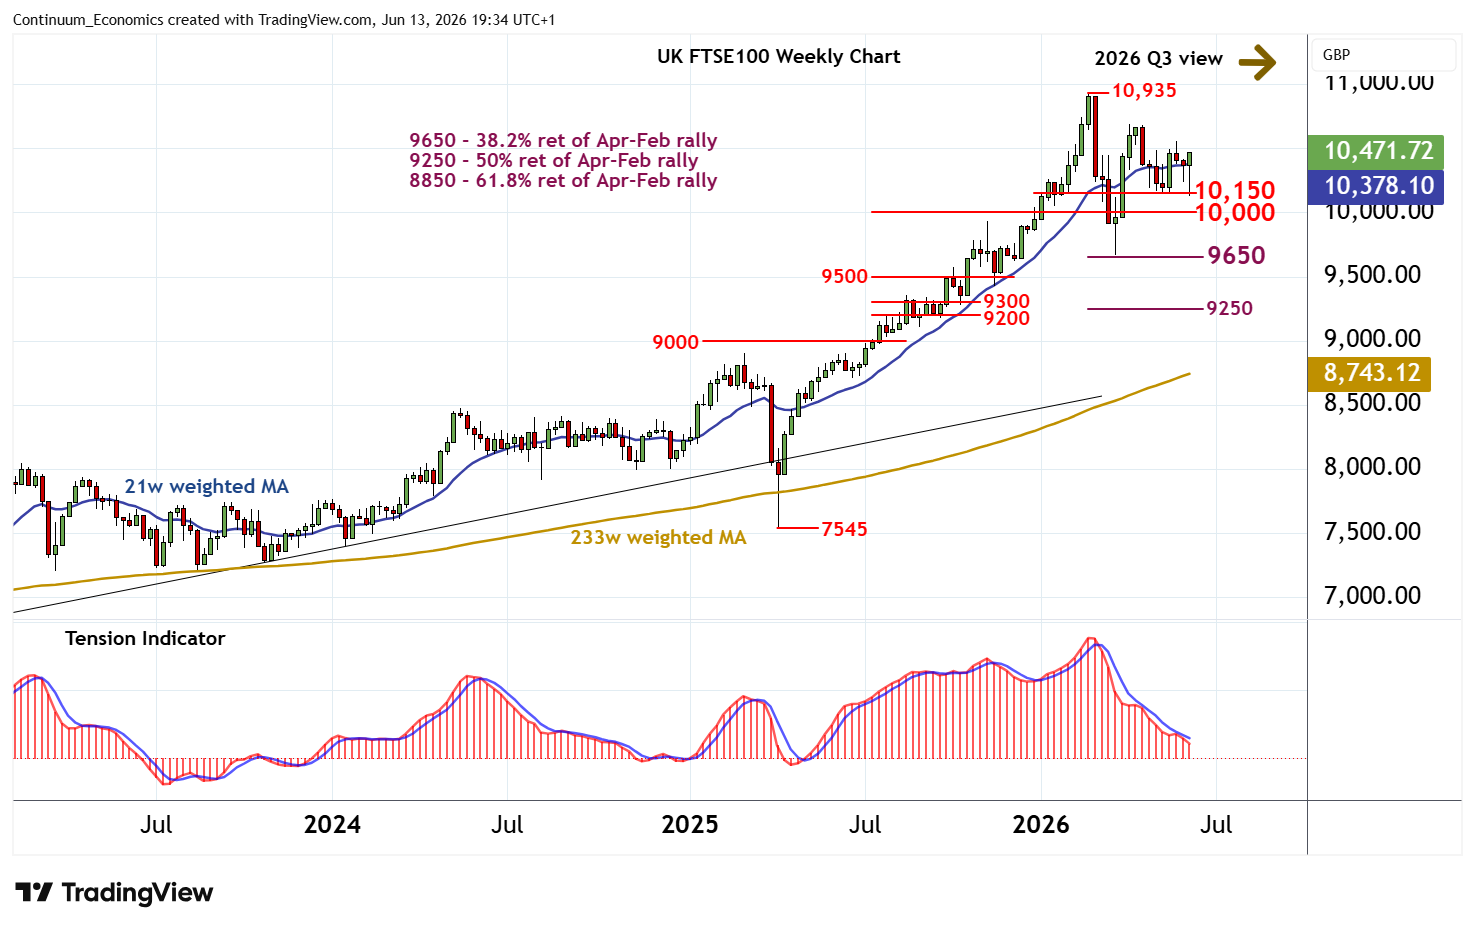
The bearish weekly Tension Indicator is countered by rising weekly stochastics, suggesting any immediate tests into here should be limited in fresh consolidation/buying interest.
A close below 10,000, however, would add weight to sentiment and open up a retest of 9670 and the 9650 Fibonacci retracement.
Continuation beneath here would confirm a near-term top in place at 10,935, as February losses then focus on the 9250 retracement, via congestion around 9500.
However, rising weekly stochastics should prompt renewed buying interest