Chart EUR/USD Update: Balanced above fresh year low
Anticipated losses have posted a fresh year low around 1.1220~
| Levels | Imp | Comment | Levels | Imp | Comment | |||
|---|---|---|---|---|---|---|---|---|
| R4 | 1.1450 | congestion | S1 | 1.1220~ | * | 1 Oct YTD low | ||
| R3 | 1.1400 | ** | congestion | S2 | 1.1200 | ** | break level | |
| R2 | 1.1325 | ** | 24 Jun (m) low | S3 | 1.1130 | ** | 50% ret of 2025-2026 rally | |
| R1 | 1.1280/00 | ** | break level; congestion | S4 | 1.1100 | figure |
*Asterisk denotes strength of level
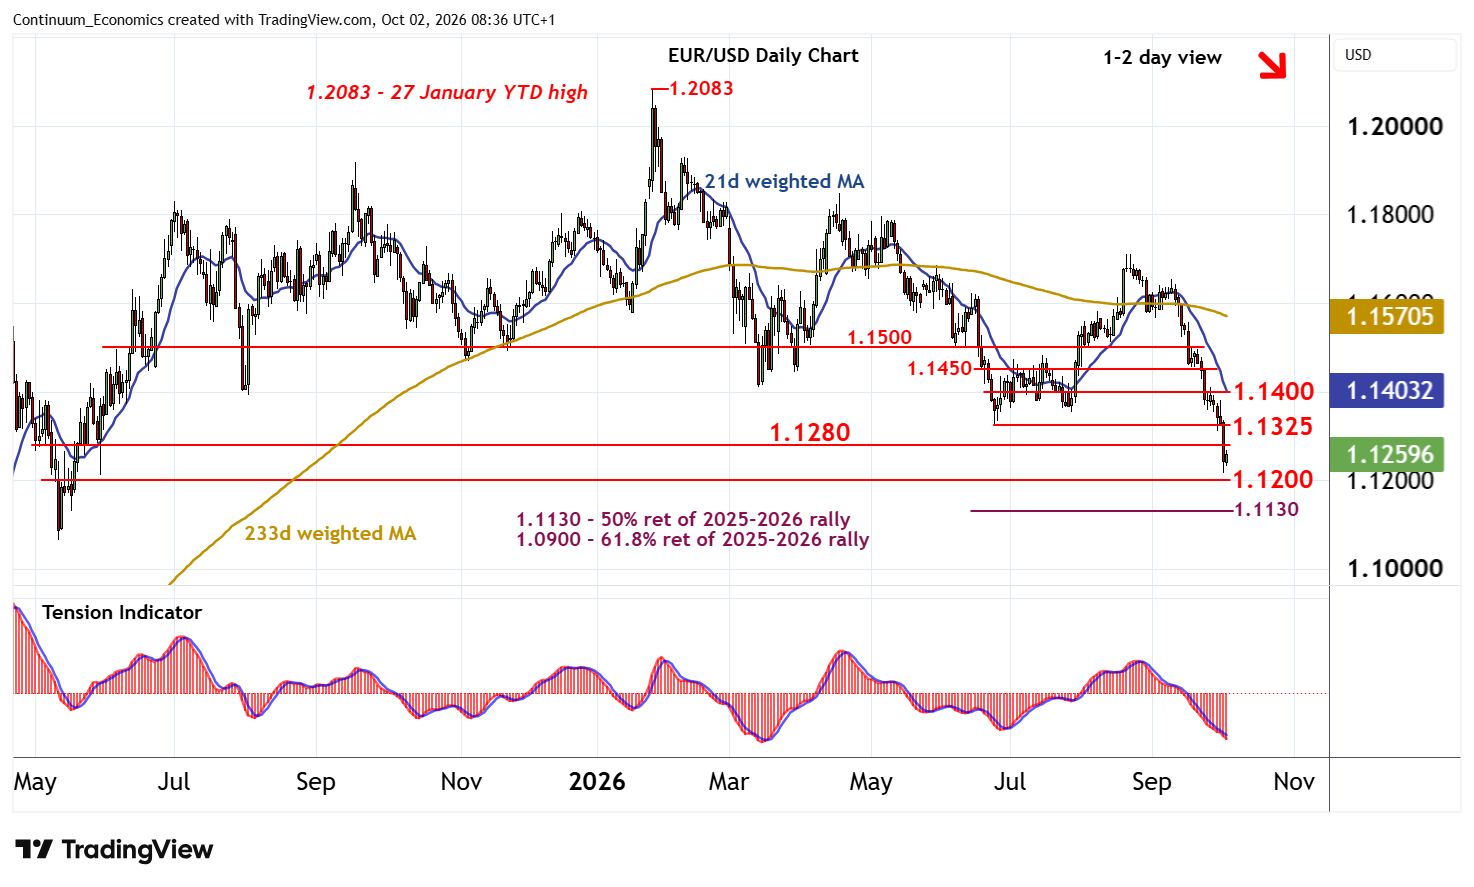
08:30 BST - Anticipated losses have posted a fresh year low around 1.1220~, before giving way to a bounce to 1.1260 as oversold intraday studies unwind. Oversold daily stochastics are ticking higher, suggesting room for a test of strong resistance within the 1.1280 - 1.1300 range. But the negative daily Tension Indicator and bearish weekly charts should prompt renewed selling interest towards here. A close above here, however, will help to stabilise price action and prompt consolidation beneath congestion around 1.1400.
Following cautious/corrective trade, fresh losses are looked for. A later break below 1.1220 will open up 1.1200, with room for continuation of January losses towards the 1.1130 Fibonacci retracement. Weekly stochastics are approaching oversold areas, suggesting short-covering could develop towards here.