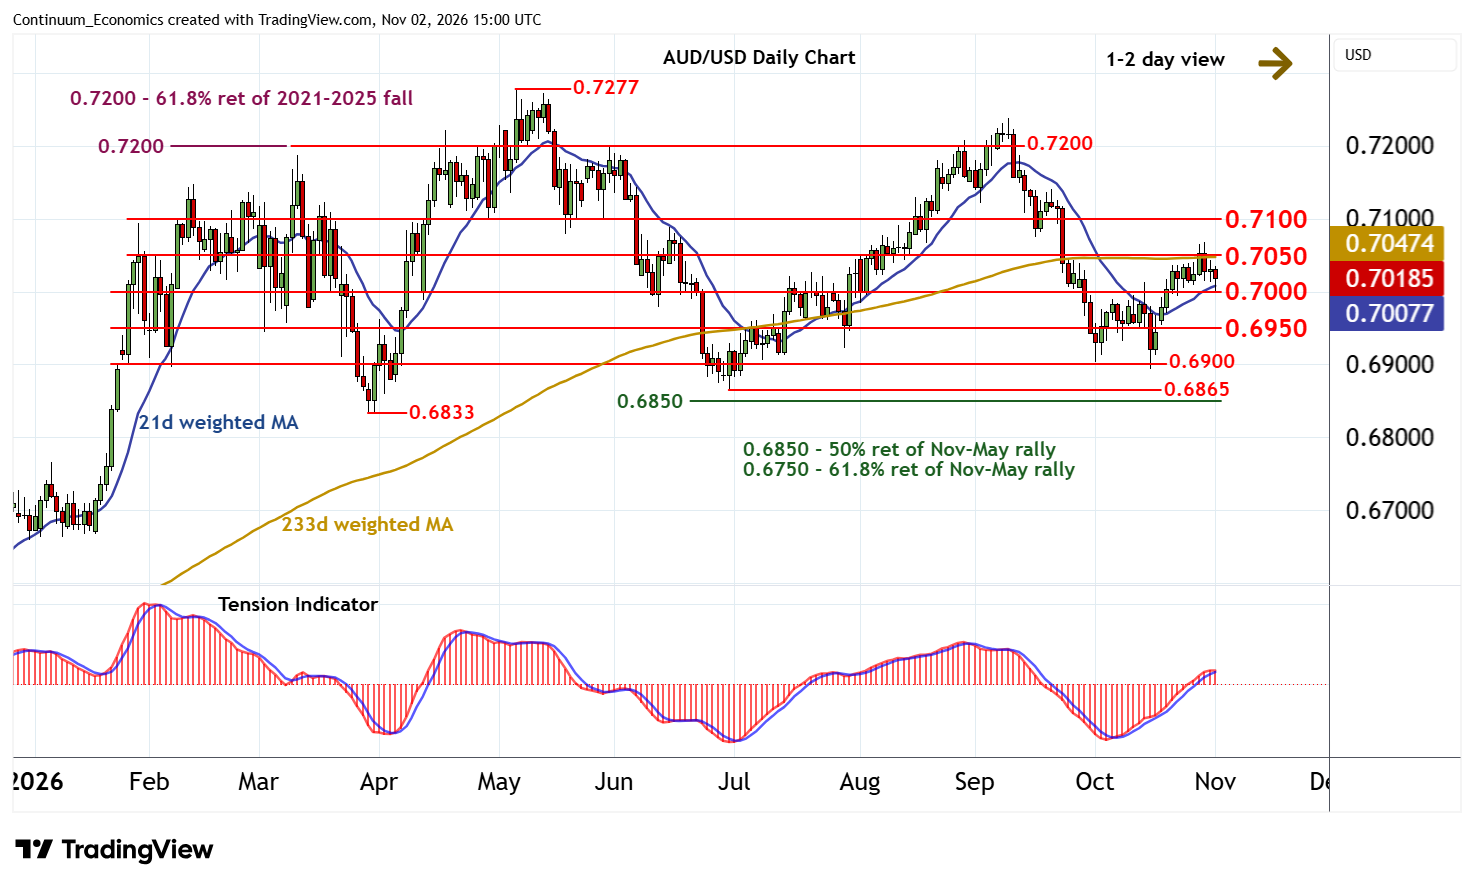
Chart AUD/USD Update: Lower in range
The anticipated drift lower has reached congestion support at 0.7000
| Levels | Imp | Comment | Levels | Imp | Comment | |||
|---|---|---|---|---|---|---|---|---|
| R4 | 0.7200 | ** | congestion | S1 | 0.7000 | * | congestion | |
| R3 | 0.7140 | ** | 21 Sep (w) high | S2 | 0.6950 | * | break level | |
| R2 | 0.7100 | ** | congestion | S3 | 0.6900 | ** | congestion | |
| R1 | 0.7050 | * | congestion | S4 | 0.6865 | ** | 30 Jun (m) low |
Asterisk denotes strength of level
14:45 GMT - The anticipated drift lower has reached congestion support at 0.7000, where a tick higher in oversold intraday studies is prompting choppy trade. Overbought daily stochastics are unwinding and the positive daily Tension Indicator is coming under pressure, suggesting room for further losses in the coming sessions. A break beneath here will add weight to sentiment and open up a test of 0.6950. Unwinding oversold weekly stochastics could limit any initial tests in fresh consolidation, before negative longer-term charts prompt further losses.
Meanwhile, resistance remains at congestion around 0.7050. Any fresh tests above here should meet renewed selling interest beneath further congestion around 0.7100.