Chart EUR/USD Update: Consolidating
Little change, as mixed intraday studies keep near-term sentiment cautious
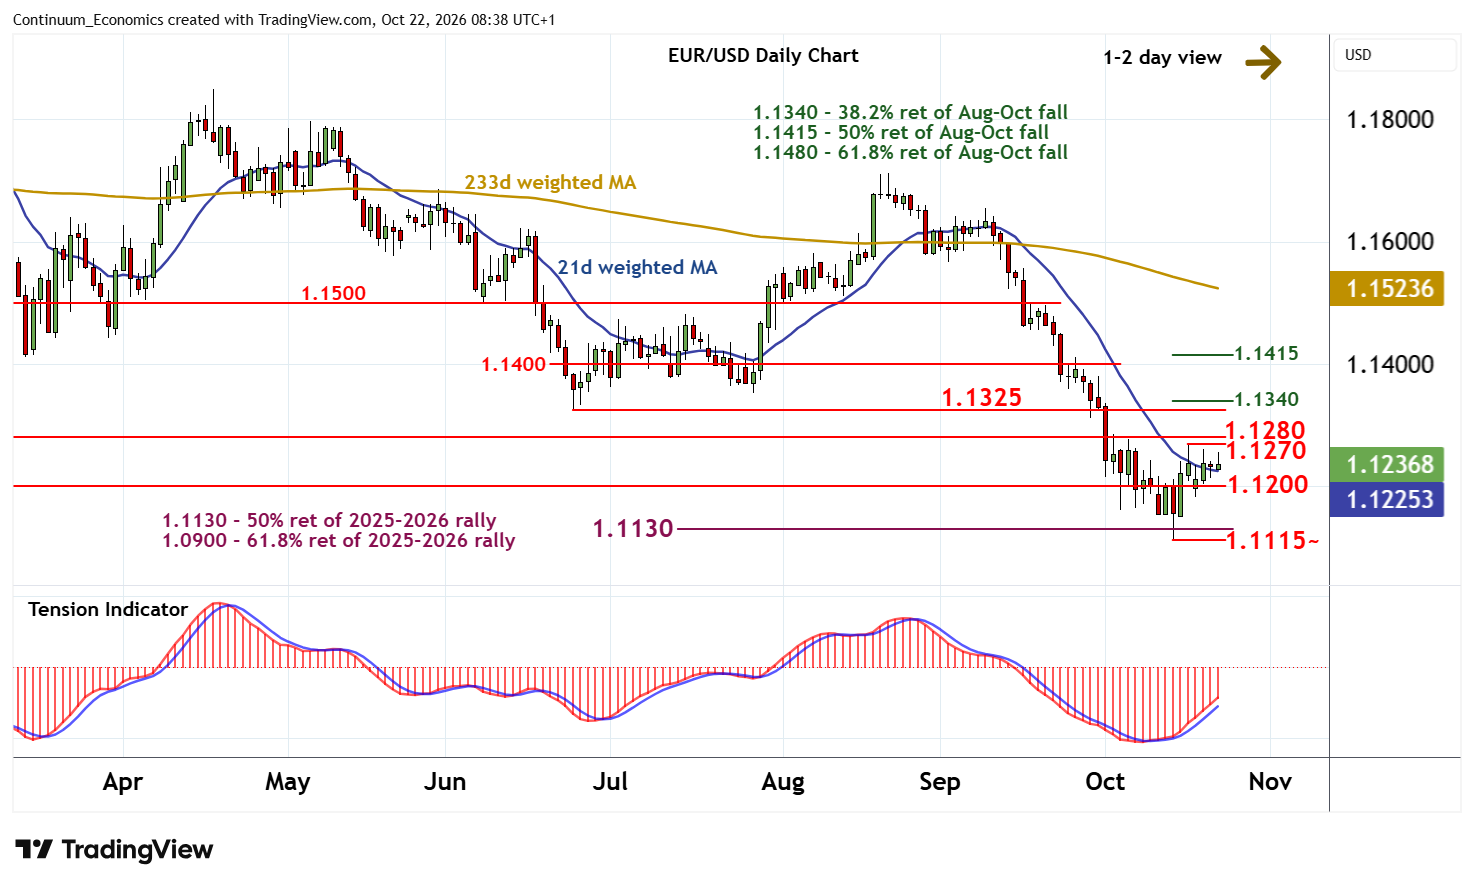
| Levels | Imp | Comment | Levels | Imp | Comment | |||
|---|---|---|---|---|---|---|---|---|
| R4 | 1.1340 | ** | 38.2% ret of Aug-Oct fall | S1 | 1.1200 | ** | break level | |
| R3 | 1.1325 | ** | 24 Jun (m) low | S2 | 1.1130 | ** | 50% ret of 2025-2026 rally | |
| R2 | 1.1300 | ** | congestion | S3 | 1.1100/15 | ** | figure; 14 Oct YTD low | |
| R1 | 1.1270/80 | ** | 16 Oct (w) high; break level | S4 | 1.1065 | ** | 12 May (m) low |
*Asterisk denotes strength of level
08:30 BST - Little change, as mixed intraday studies keep near-term sentiment cautious and extend consolidation within the wide 1.1200 - 1.1270 range. Daily readings are improving and oversold weekly stochastics are ticking higher, suggesting room for a drift towards resistance at the 1.1270 weekly high of 16 October and the 1.1280 break level. A close above here, if seen, would turn sentiment positive and confirm continuation of mid-October gains towards the 1.1325 - 1.1340 range. The bearish weekly Tension Indicator and negative longer-term charts should prompt fresh profit-taking/consolidation towards here.
Meanwhile, support remains at 1.1200. A close beneath here will add weight to sentiment and prompt a deeper retracement towards critical support at the 1.1115 current year low of 14 October and the 1.1150 Fibonacci retracement.