Weekly Chart GBP/USD Update: Under pressure
The anticipated test of 1.3600 has given way to a deeper retracement, with prices currently balanced above support at the 1.3525 Fibonacci retracement
The anticipated test of 1.3600 has given way to a deeper retracement, with prices currently balanced above support at the 1.3525 Fibonacci retracement.
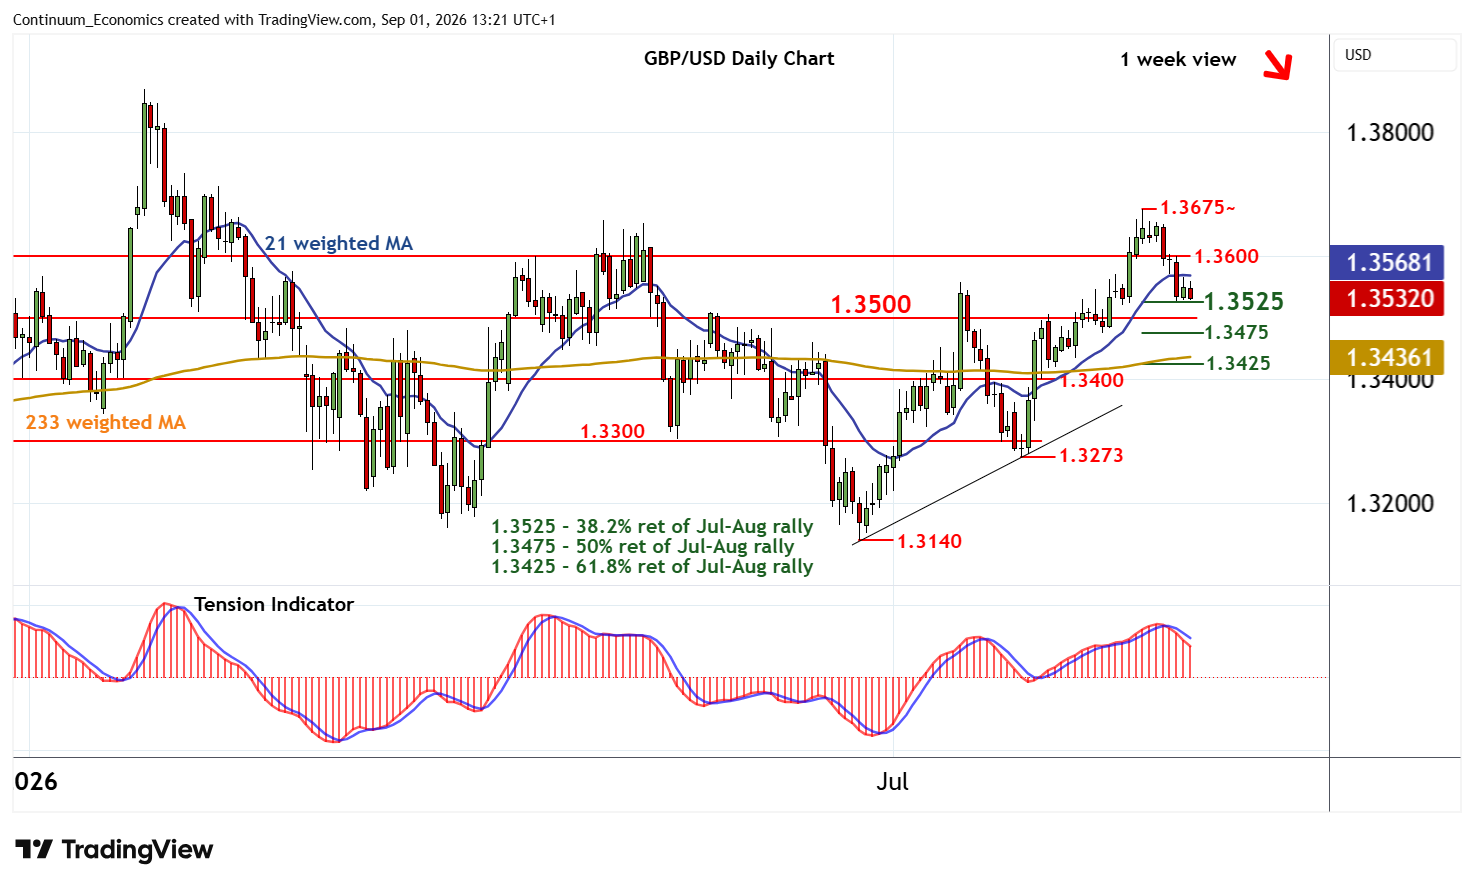
Daily stochastics remain under pressure and the daily Tension Indicator has turned bearish, highlighting room for a deeper retracement in the coming sessions.
A break below 1.3525 will target congestion around 1.3500. Beneath here is the 1.3475 retracement. But any deeper losses should give way to short-covering/consolidation above 1.3400/25, as daily stochastics are already oversold.
Meanwhile, resistance remains at congestion around 1.3650 and extends to 1.3700.
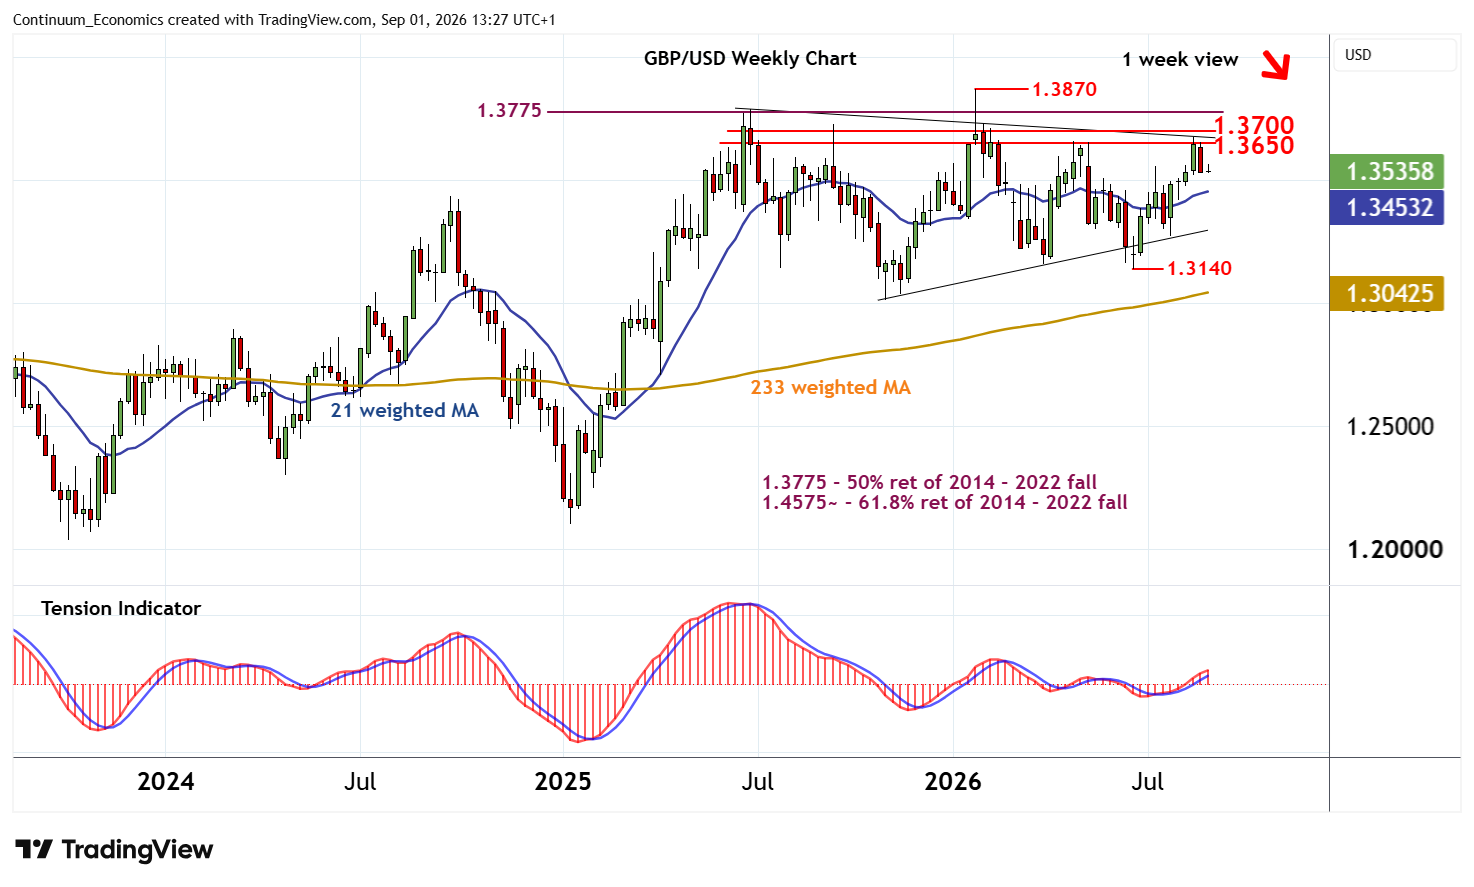
Weekly stochastics are unwinding overbought areas and the positive weekly Tension Indicator is showing early signs of flattening, suggesting a more cautious tone.
Any immediate gains should give way to consolidation beneath here.
However, a close above 1.3700 would complete a multi-month triangle and confirm continuation of gains from the 1.3140 monthly low of 24 June towards the 1.3775 multi-year Fibonacci retracement. But already overbought weekly stochastics and mixed longer-term charts could limit any initial tests of here in renewed profit-taking/consolidation.
(A close above the 1.3870 multi-year high of 27 January would confirm continuation of gains from the 1.0360 year low of September 2022.)