Chart USD Index DXY Update: Extending losses
Consolidation is giving way to the anticipated break lower
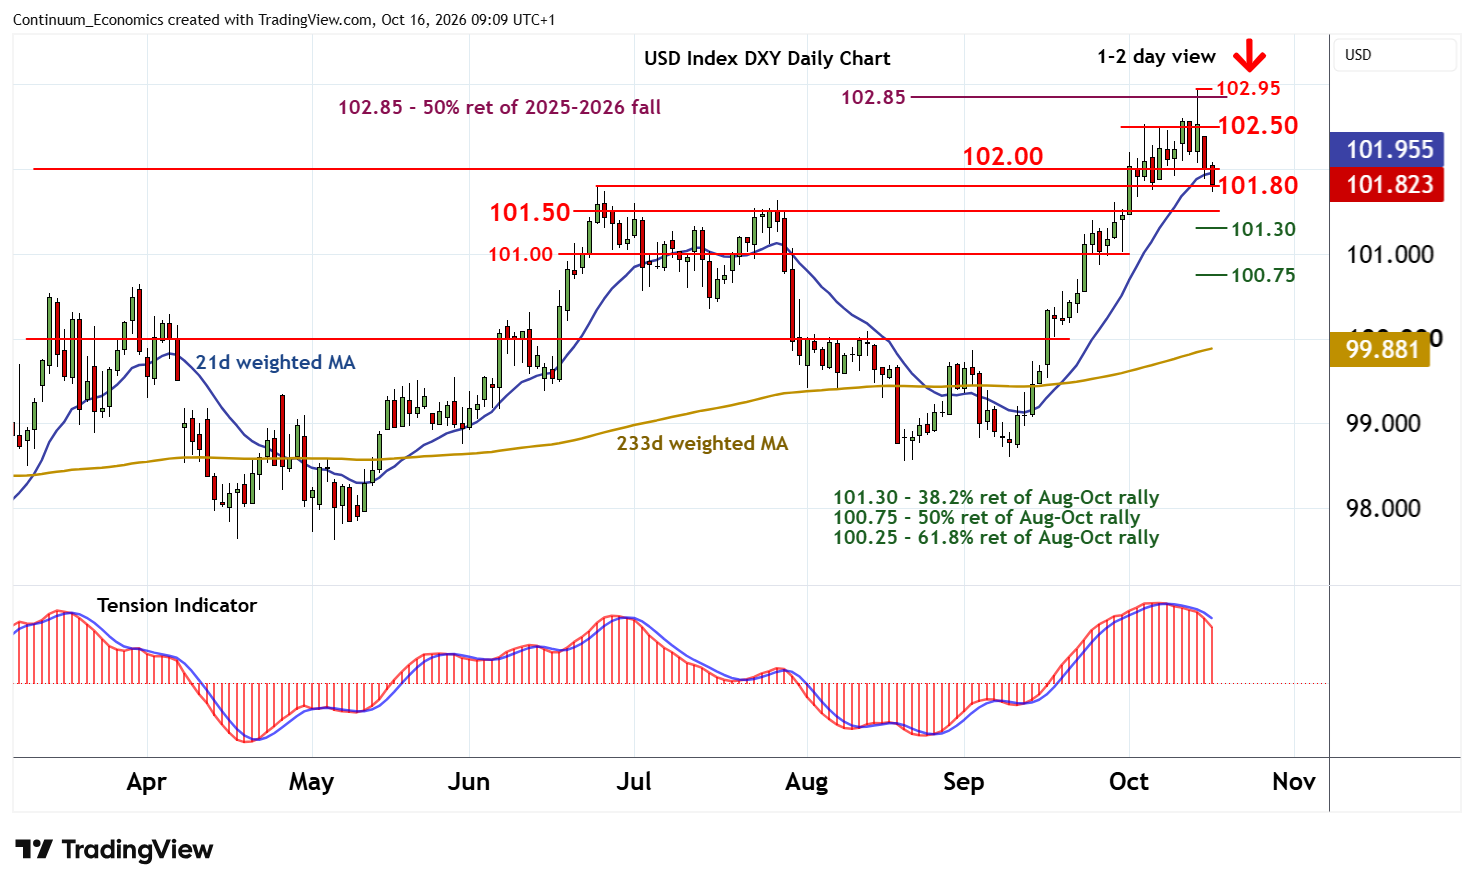
| Levels | Imp | Comment | Levels | Imp | Comment | |||
|---|---|---|---|---|---|---|---|---|
| R4 | 102.95/00 | ** | 14 Oct YTD high; congestion | S1 | 101.80 | * | 24 Jun (m) high | |
| R3 | 102.85 | ** | 50% ret of 2025-2026 fall | S2 | 101.50 | * | range highs | |
| R2 | 102.50 | congestion | S3 | 101.30 | * | 38.2% ret of Aug-Oct rally | ||
| R1 | 102.00 | ** | congestion | S4 | 101.00 | ** | congestion |
Asterisk denotes strength of level
08:50 BST - Consolidation is giving way to the anticipated break lower, with prices currently pressuring support at the 101.80 monthly high of 24 June. Intraday studies are bearish and daily readings are also under pressure, highlighting room for a break beneath here and extension of losses from the 102.95 current year high of 14 October towards the 101.50 range highs. Still lower is the 101.30 Fibonacci retracement. But already oversold daily stochastics and positive weekly charts should limit any initial tests of here in short-covering/consolidation.
Meanwhile, resistance is lowered to congestion around 102.00. A close back above here would help to stabilise sentiment and prompt fresh consolidation beneath congestion around 102.50.