Chart EUR/USD Update: Consolidating - studies under pressure
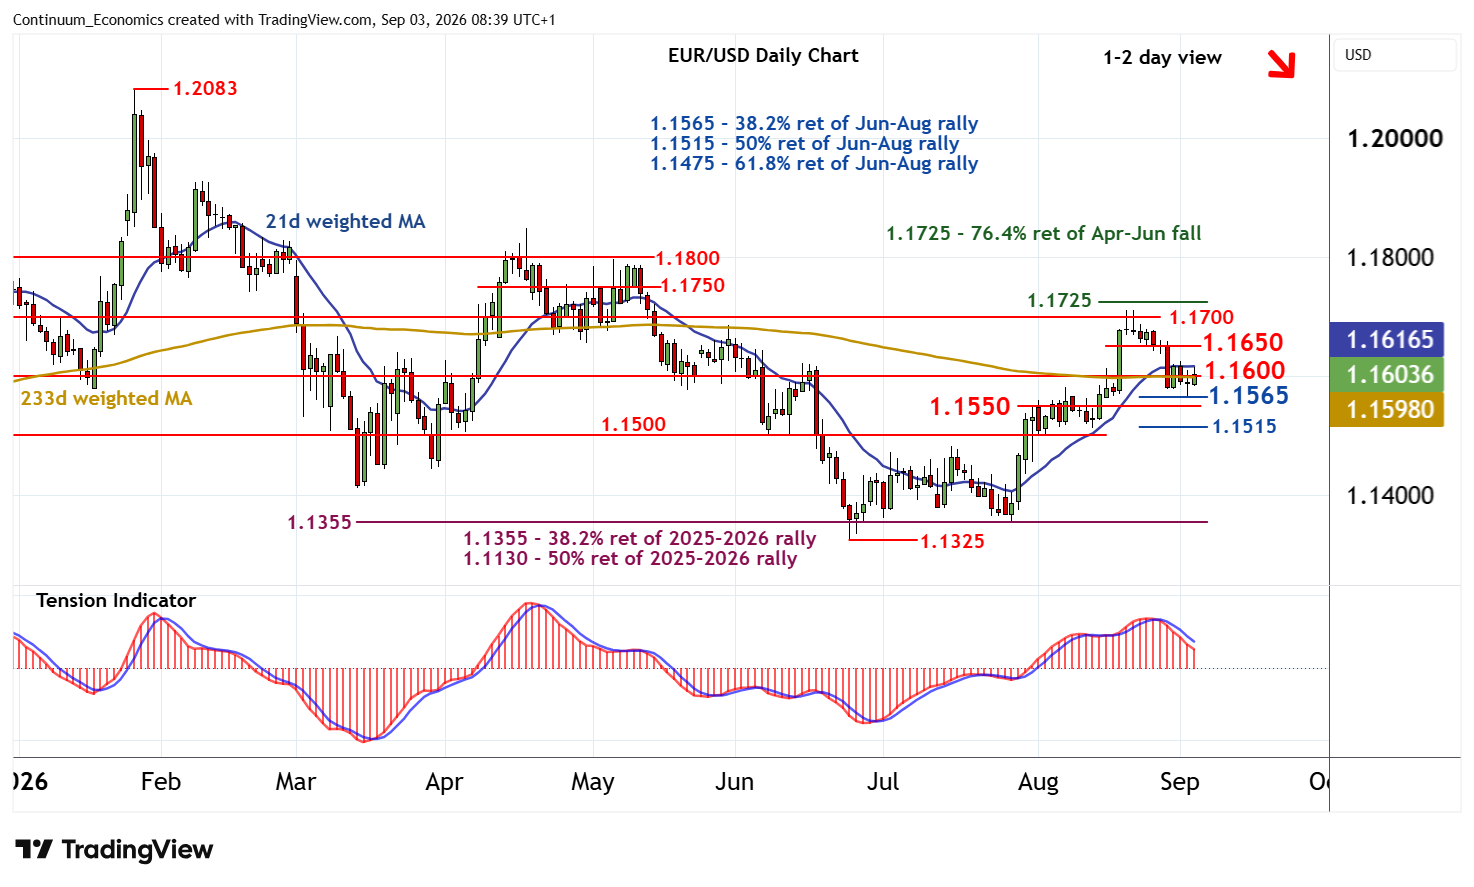
The test below support at the 1.1578 low from 28-31 August has bounced from the 1.1565 Fibonacci retracement
| Levels | Imp | Comment | Levels | Imp | Comment | |||
|---|---|---|---|---|---|---|---|---|
| R4 | 1.1725 | ** | 76.4% ret of Apr-Jun fall | S1 | 1.1565 | * | 38.2% ret of Jun-Aug rally | |
| R3 | 1.1700 | * | congestion | S2 | 1.1550 | * | congestion | |
| R2 | 1.1650 | recent range lows | S3 | 1.1515 | * | 50% ret of Jun-Aug rally | ||
| R1 | 1.1600 | * | congestion | S4 | 1.1500 | * | congestion |
*Asterisk denotes strength of level
08:30 BST - The test below support at the 1.1578 low from 28-31 August has bounced from the 1.1565 Fibonacci retracement, as intraday studies turn higher, with prices currently pressuring congestion resistance at 1.1600. A test above here cannot be ruled out. But negative daily readings and unwinding overbought weekly stochastics should limit scope in renewed selling interest beneath 1.1650.
Following cautious trade, fresh losses are looked for. A close below 1.1565 will add weight to sentiment and extend late-August losses towards congestion around 1.1550. Already oversold daily stochastics could limit any initial tests in fresh consolidation, before deteriorating weekly charts open up a test of support at further congestion around 1.1500 and the 1.1515 retracement.