Published: 2026-07-02T01:53:43.000Z
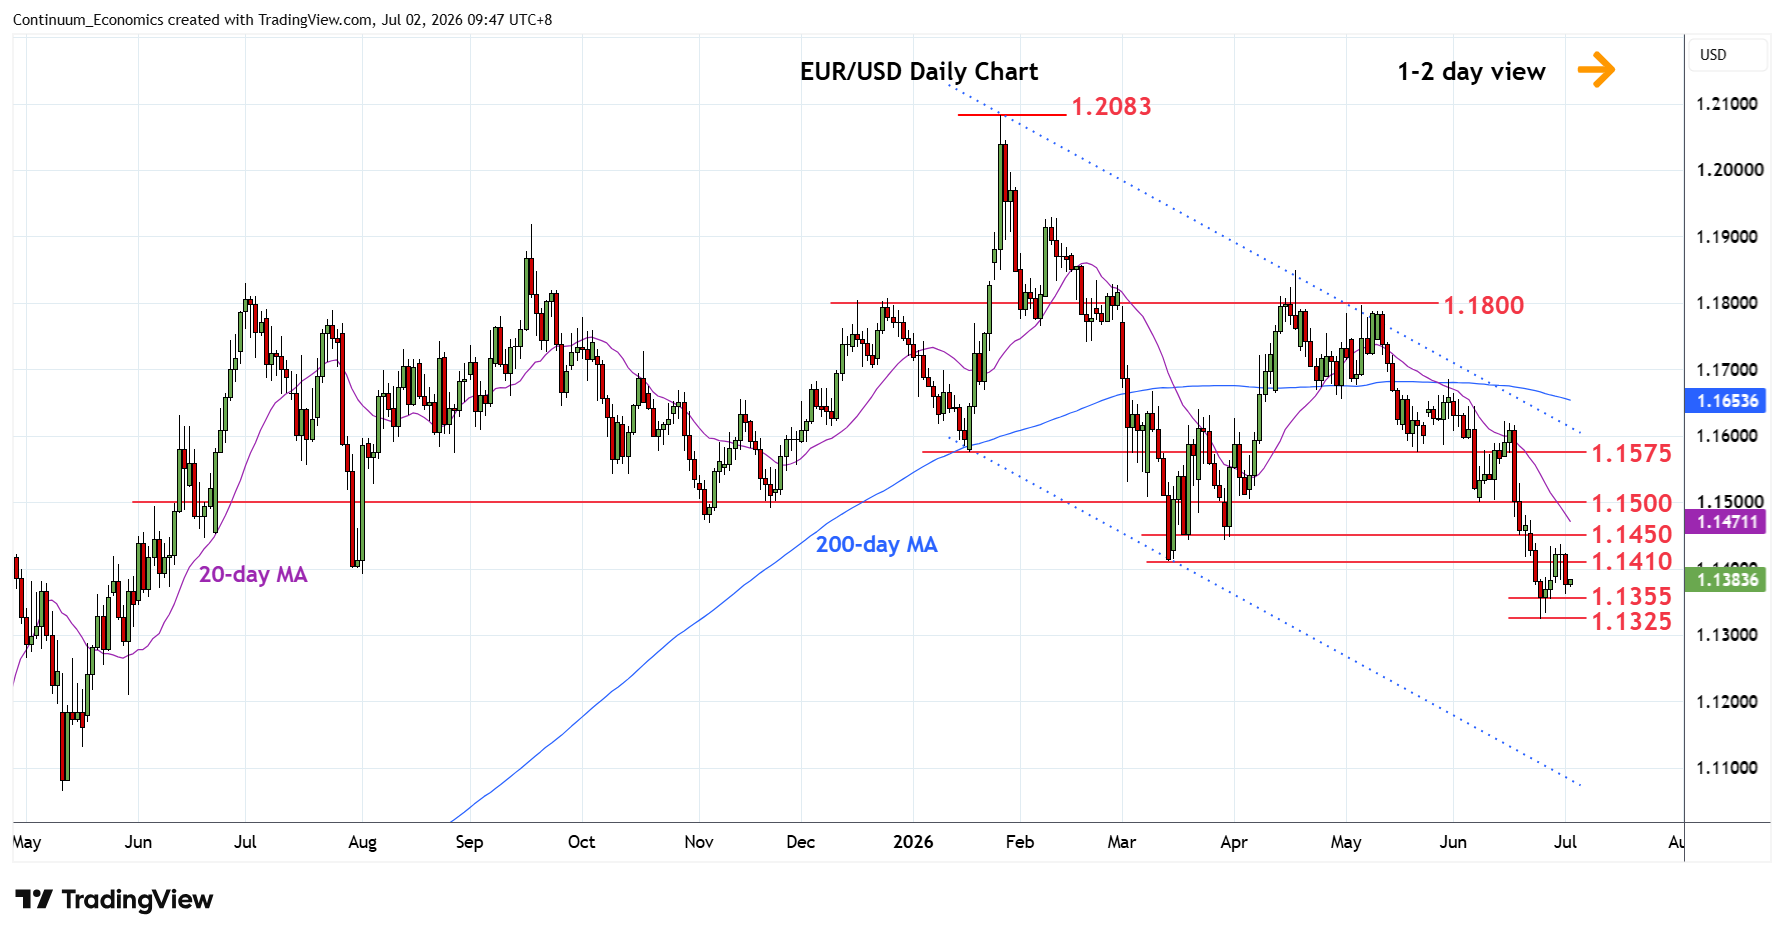
Chart EUR/USD Update: Settled back in consolidation
1
Turned lower following failure to sustain break above the 1.1400/10 resistance with gains checked at the 1.1436 high
| Levels | Imp | Comment | Levels | Imp | Comment | |||
|---|---|---|---|---|---|---|---|---|
| R4 | 1.1550/75 | ** | congestion, May low | S1 | 1.1355 | * | 38.2% 2025/2026 rally | |
| R3 | 1.1500 | ** | 8 Jun low | S2 | 1.1325 | ** | 24 Jun YTD low | |
| R2 | 1.1450 | * | congestion | S3 | 1.1275 | * | 2023 year high | |
| R1 | 1.1410 | * | Mar low | S4 | 1.1210/00 | ** | congestion, 2024 yr high |
Asterisk denotes strength of level
01:50 GMT - Turned lower following failure to sustain break above the 1.1400/10 resistance with gains checked at the 1.1436 high. Daily studies are unwinding oversold readings and suggest scope for stronger bounce. Above 1.1436 high will see room to the 1.1450 congestion then the strong resistance at the 1.1500 level. Would take break here to fade the downside pressure and open up room for stronger recovery to retrace losses from April swing high. Meanwhile, support at 1.1355/25 area expected to underpin. Below here will extend the January losses.