Chart GBP/USD Update: Daily studies under pressure
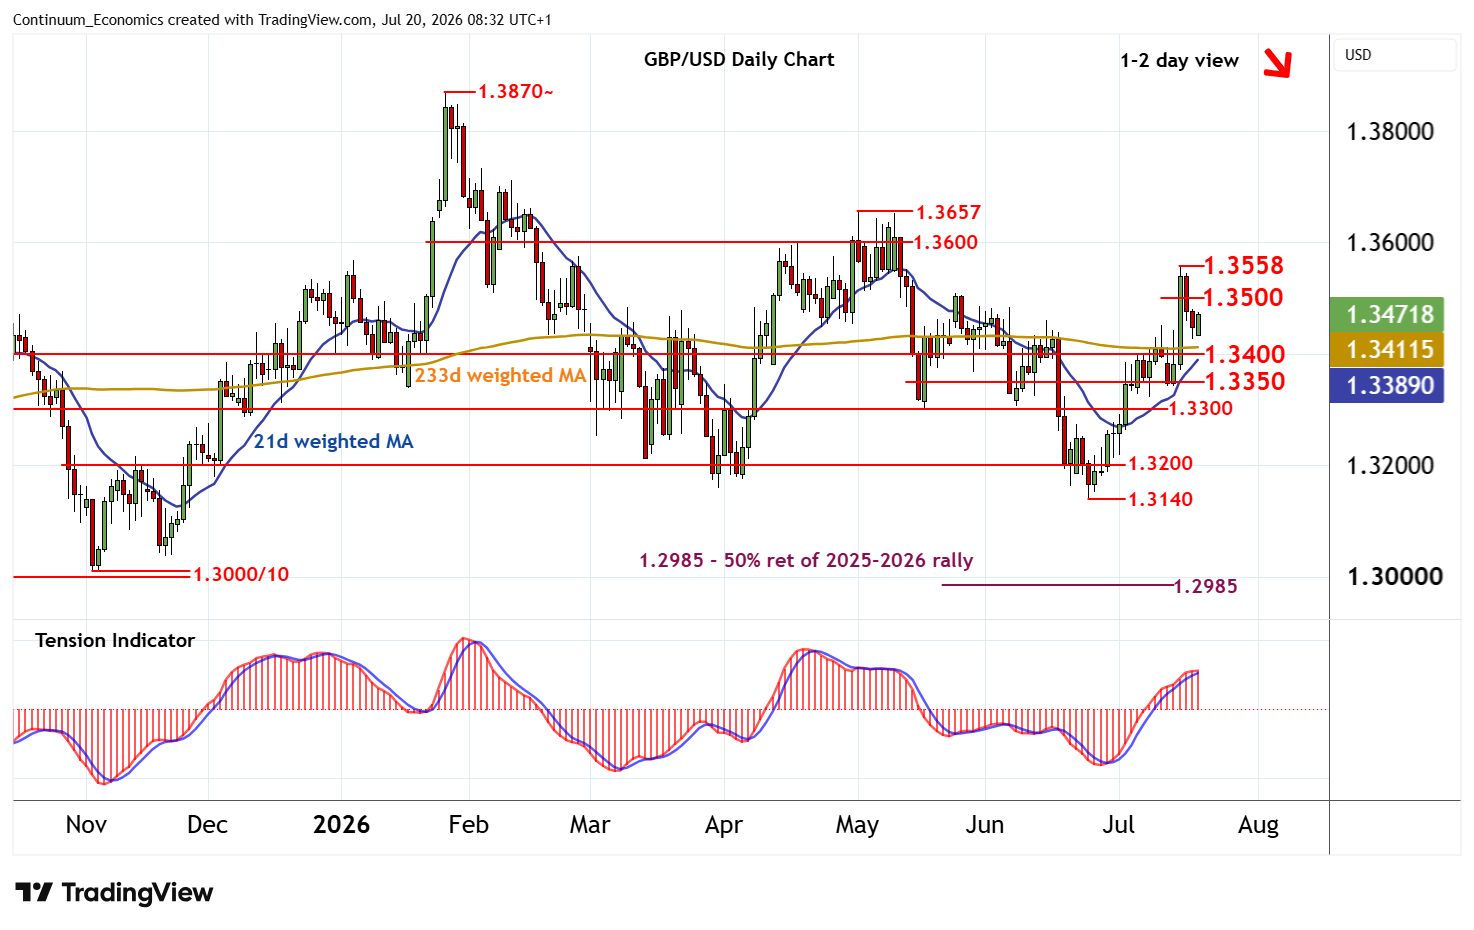
The pullback from the 1.3558 weekly high of 15 July is giving way to a bounce from 1.3425
| Level | Comment | Level | Comment | |||||
|---|---|---|---|---|---|---|---|---|
| R4 | 1.3657 | ** | 1 May (m) high | S1 | 1.3400 | ** | congestion | |
| R3 | 1.3600 | ** | congestion | S2 | 1.3350 | * | congestion | |
| R2 | 1.3550/58 | * | congestion; 15 Jul (w) high | S3 | 1.3300 | ** | congestion | |
| R1 | 1.3500 | * | congestion | S4 | 1.3250 | intraday break level |
Asterisk denotes strength of level
08:10 BST - The pullback from the 1.3558 weekly high of 15 July is giving way to a bounce from 1.3425, as intraday studies turn higher, with prices currently trading around 1.3465. Daily stochastics are falling and the flat daily Tension Indicator is turning down, suggesting further gains could meet renewed selling interest towards congestion resistance at 1.3500. An unexpected close above here would help to stabilise price action and prompt consolidation beneath 1.3550/58. Following corrective trade, fresh losses are looked for. A break below 1.3425 will open up congestion around 1.3400. But rising weekly charts should limit any immediate tests beneath here in renewed buying interest/consolidation above congestion around 1.3350.