Monthly U.S. Chart S&P 500: Leaning lower from October, all-time high
Bullish gains has seen market posting fresh all-time high at 7845 in early October just marginally higher then the mid-August peak at 7816
Bullish gains has seen market posting fresh all-time high at 7845 in early October just marginally higher then the mid-August peak at 7816. The resulting wedge pattern and bearish divergence on momentum oscillators suggest the bullish trend losing momentum and caution corrective pullback.
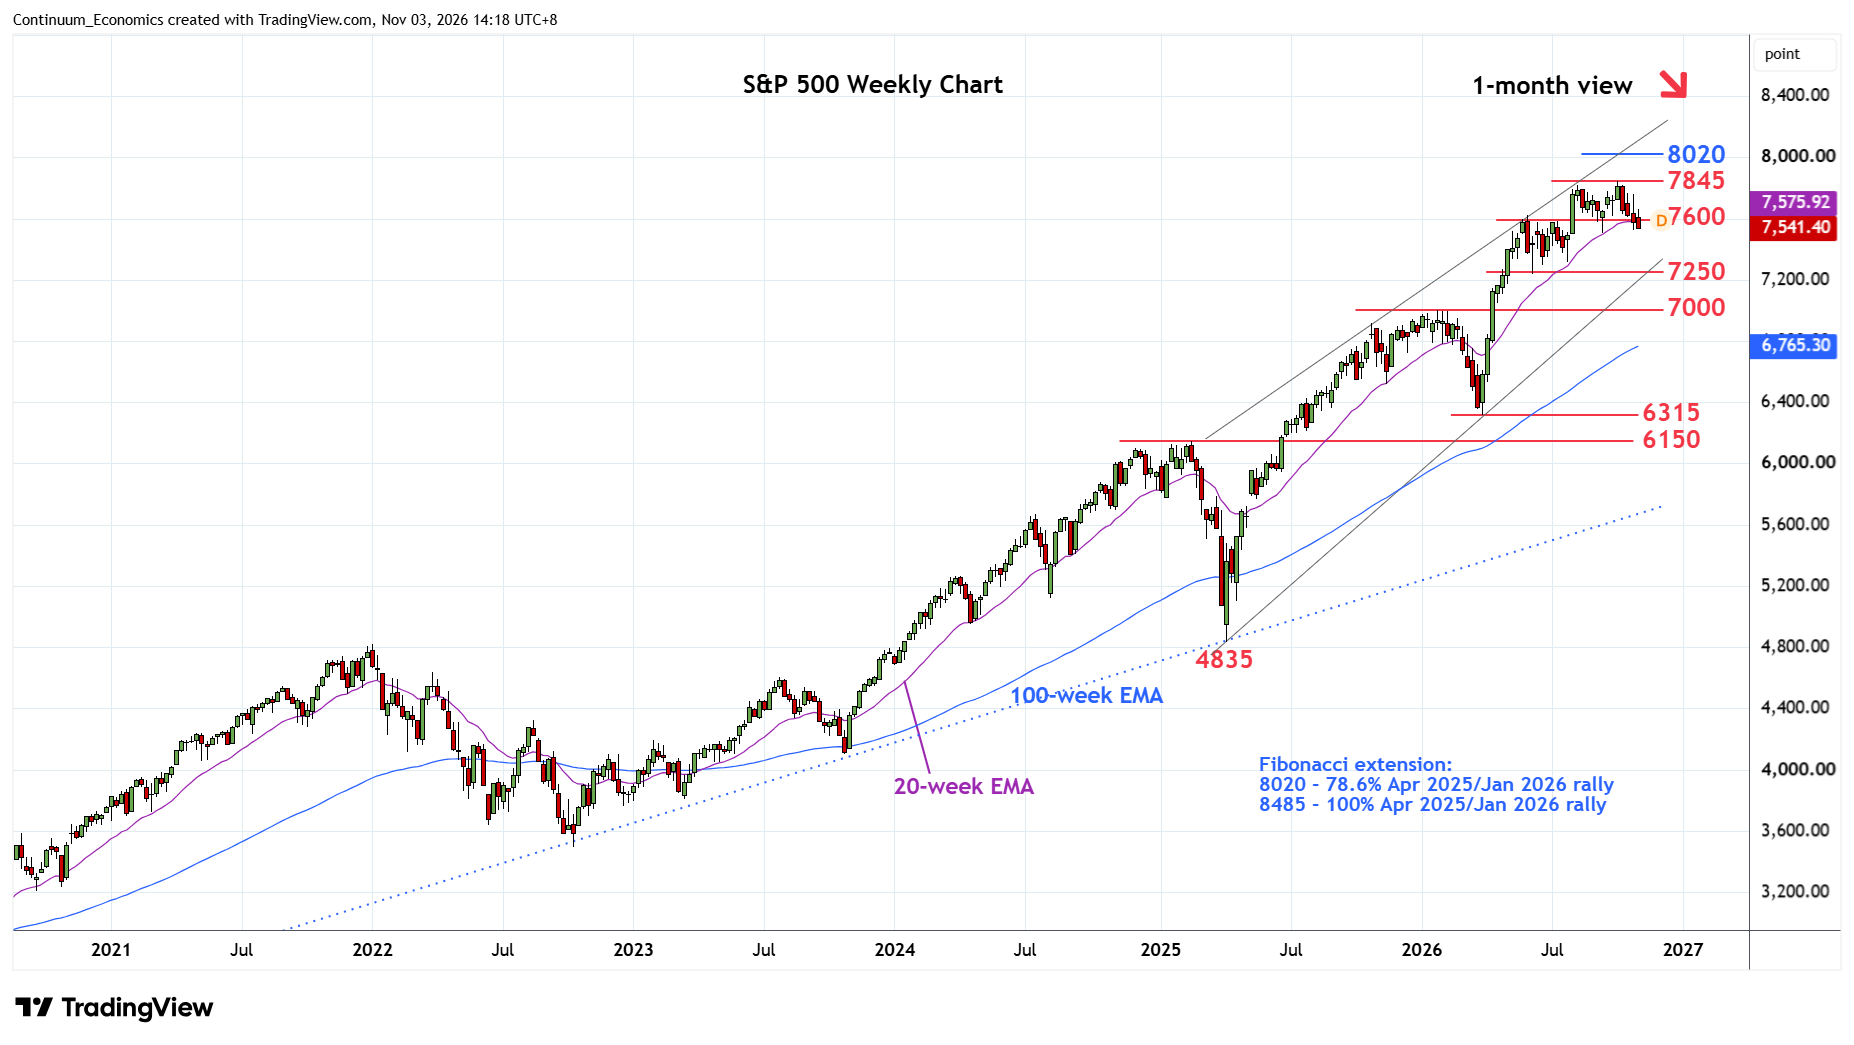
Below the 7600 level see support starting at 7508 September low. Break here will open up room for deeper pullback to support at the 7250/7200 area and wedge support from the April low. Weekly studies are unwinding overbought readings and monthly studies have turned flat suggesting scope for break here to open up room for deeper pullback correct strong gains from the March low. Lower will see room to support at the January high at the 7000 figure and 6800 congestion area.
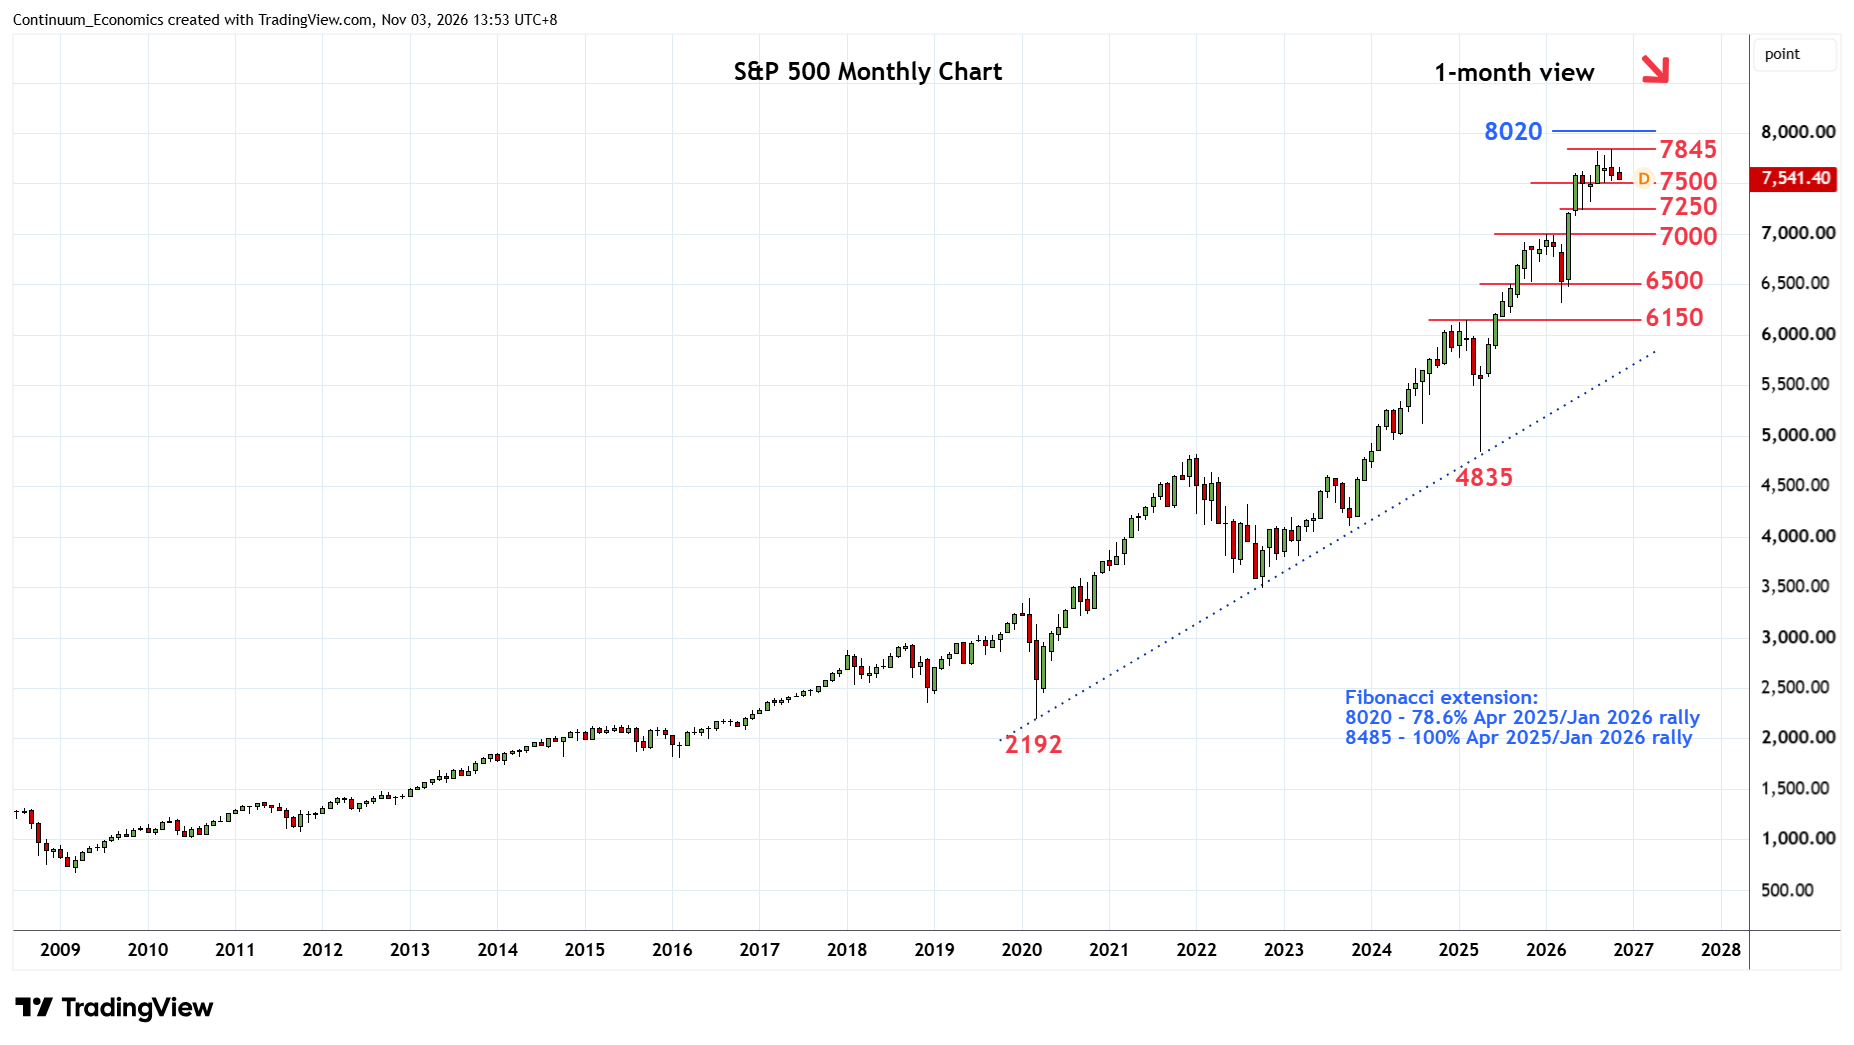
Meanwhile, resistance is at the 7816 July high and extend to the 7845 October all-time high. Break above these will extend the underlying bull trend and see potential to the 8000 figure then the 8020, Fibonacci projection target. Gains beyond these will see room to 8485, equality projection of the April 2025/January 2026 rally.