Published: 2026-06-05T08:02:44.000Z
Chart USD Index DXY Update: Leaning lower in range
3
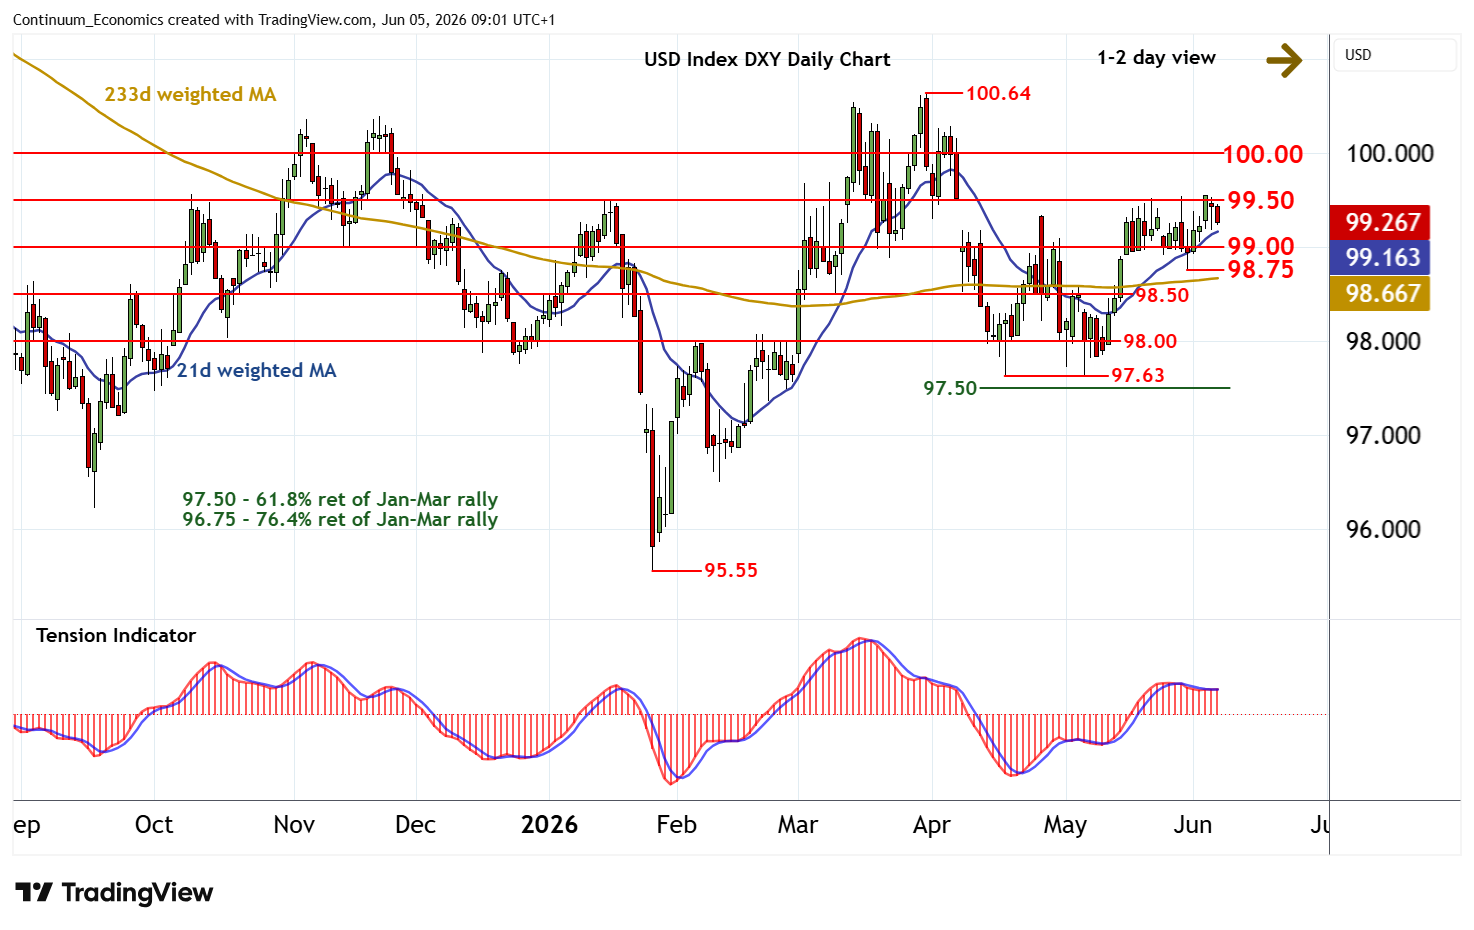
Consolidation beneath resistance at 99.50 is giving way to a pullback
| Levels | Imp | Comment | Levels | Imp | Comment | |||
|---|---|---|---|---|---|---|---|---|
| R4 | 100.64 | ** | 31 Mar YTD high | S1 | 99.00 | * | congestion | |
| R3 | 100.29 | * | 6 Apr (m) high | S2 | 98.75 | 29 May (w) low | ||
| R2 | 100.00 | ** | congestion | S3 | 98.50 | * | congestion | |
| R1 | 99.50 | * | congestion, gap high | S4 | 98.00 | * | congestion |
Asterisk denotes strength of level
08:55 BST - Consolidation beneath resistance at 99.50 is giving way to a pullback, as intraday studies turn down, with prices currently trading around 99.25. Daily stochastics are also turning down, highlighting room for a test of congestion support at 99.00. But the flat daily Tension Indicator and mixed weekly charts should limit any deeper losses in fresh consolidation above the 98.75 weekly low of 29 May. Meanwhile, a close above 99.50, if seen, would improve sentiment and open up stronger congestion around 100.00, where renewed selling interest is expected to appear.