Published: 2026-06-03T07:14:47.000Z
Chart GBP/JPY Update: Focus on the 216.00/216.60 highs
1
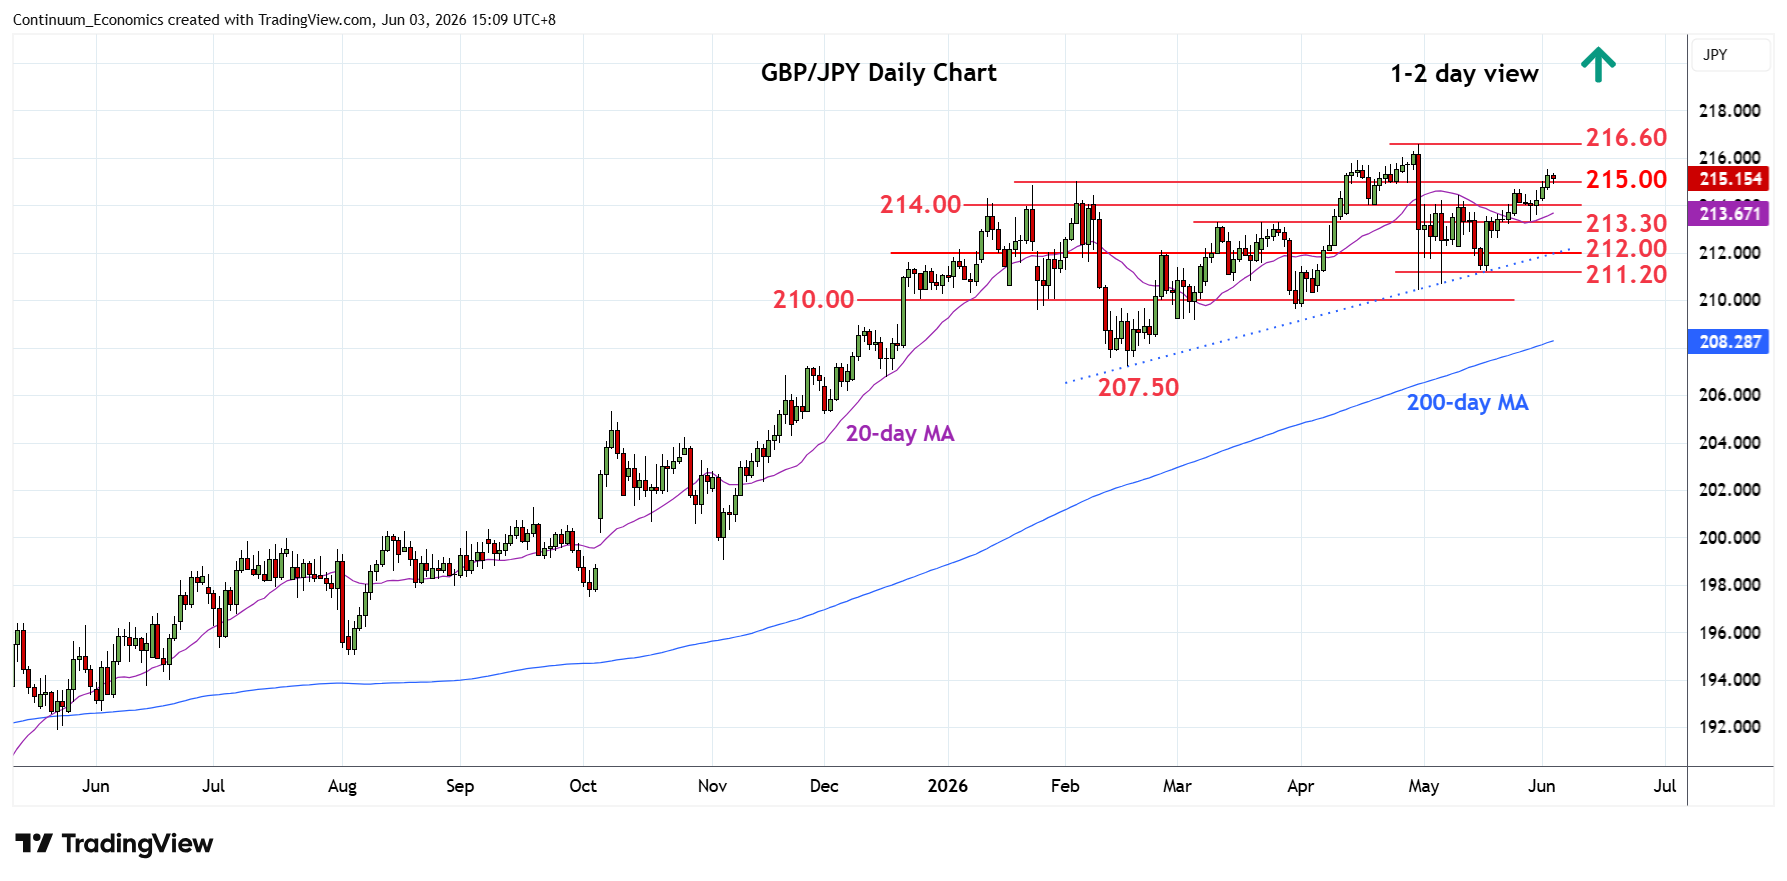
Break above resistance at the 215.00 level see prices retracing the losses from the 30 April range high
| Levels | Imp | Comment | Levels | Imp | Comment | |||
|---|---|---|---|---|---|---|---|---|
| R4 | 218.00 | * | congestion | S1 | 214.00 | * | congestion | |
| R3 | 216.60 | ** | 30 Apr YTD high | S2 | 213.30 | * | 28 May low, congestion | |
| R2 | 216.00 | * | congestion | S3 | 212.00 | * | congestion | |
| R1 | 215.50 | * | 2 Jun high | S4 | 211.20 | ** | 18 May low |
Asterisk denotes strength of level
07:15 GMT - Break above resistance at the 215.00 level see prices retracing the losses from the 30 April range high. Above the 215.50 high will see room to the 216.00 congestion then the 216.60, current year high of 30 April. Beyond these will extend the underlying bull trend from the 2020 year low and see scope to 218.00/220.00 congestion area. Meanwhile, support remains at the 214.00 level which extend to the 213.30 low of last week. This area should underpin and only failure here will return focus to the downside for retest of the 212.00/211.20 congestion and low of 18 May.