Published: 2026-08-03T01:06:35.000Z
Chart USD/JPY Update: Extending sharp losses
4
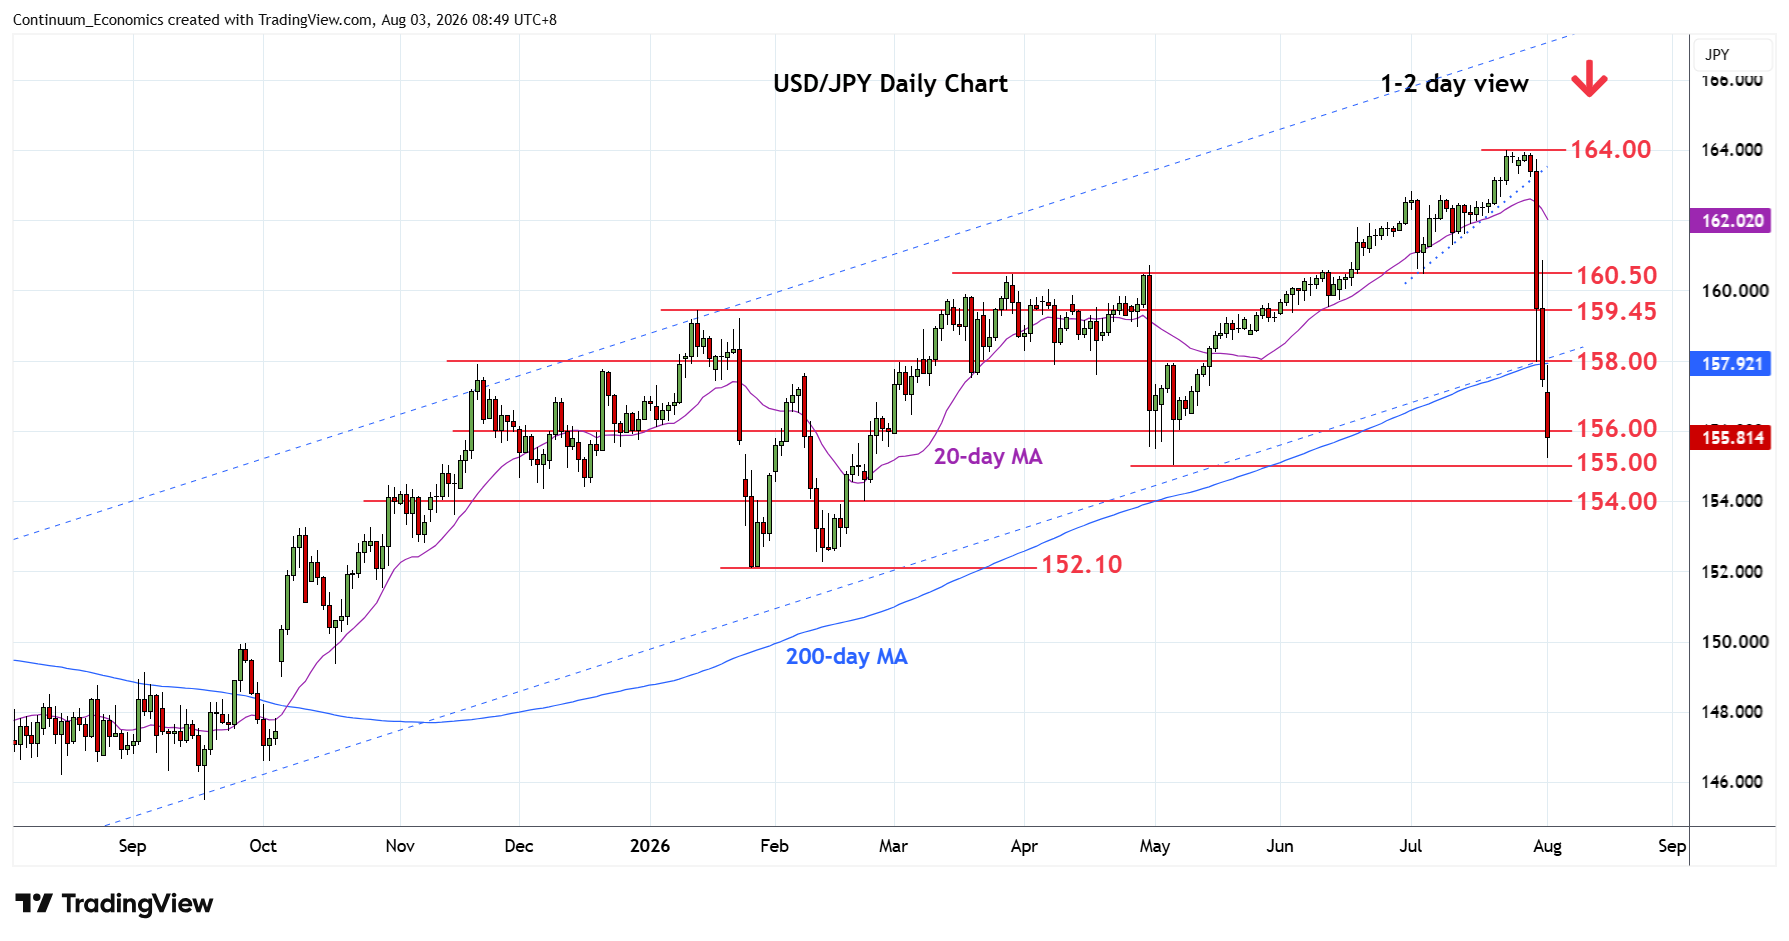
Sharply lower through the 157.00 level as prices extend sharp losses last week
| Levels | Imp | Comment | Levels | Imp | Comment | |||
|---|---|---|---|---|---|---|---|---|
| R4 | 159.45 | * | Jan high | S1 | 155.00 | ** | May low | |
| R3 | 159.00 | * | congestion | S2 | 154.85 | * | 38.2% 2025/2026 rally | |
| R2 | 157.90/00 | ** | Nov high, congestion | S3 | 154.00 | * | congestion | |
| R1 | 157.00 | * | congestion | S4 | 153.00 | * | congestion |
Asterisk denotes strength of level
01:00 GMT - Sharply lower through the 157.00 level as prices extend sharp losses last week from the 163.99 July current year high to approach the 155.00 May low. Focus stays firmly on the downside and further losses cannot be ruled out to target 154.85, 38.2% Fibonacci level. Lower still, will see room to 154.00/153.00 congestion area then the critical 152.00/151.90, 50% Fibonacci level and 2022/2023 year highs. Meanwhile, resistance starts at 157.00 congestion then the 157.90/158.00 high of November and previous channel support from April 2025 year low.