Published: 2026-08-05T00:22:27.000Z
Chart AUD/USD Update: Pressuring .7050 resistance
2
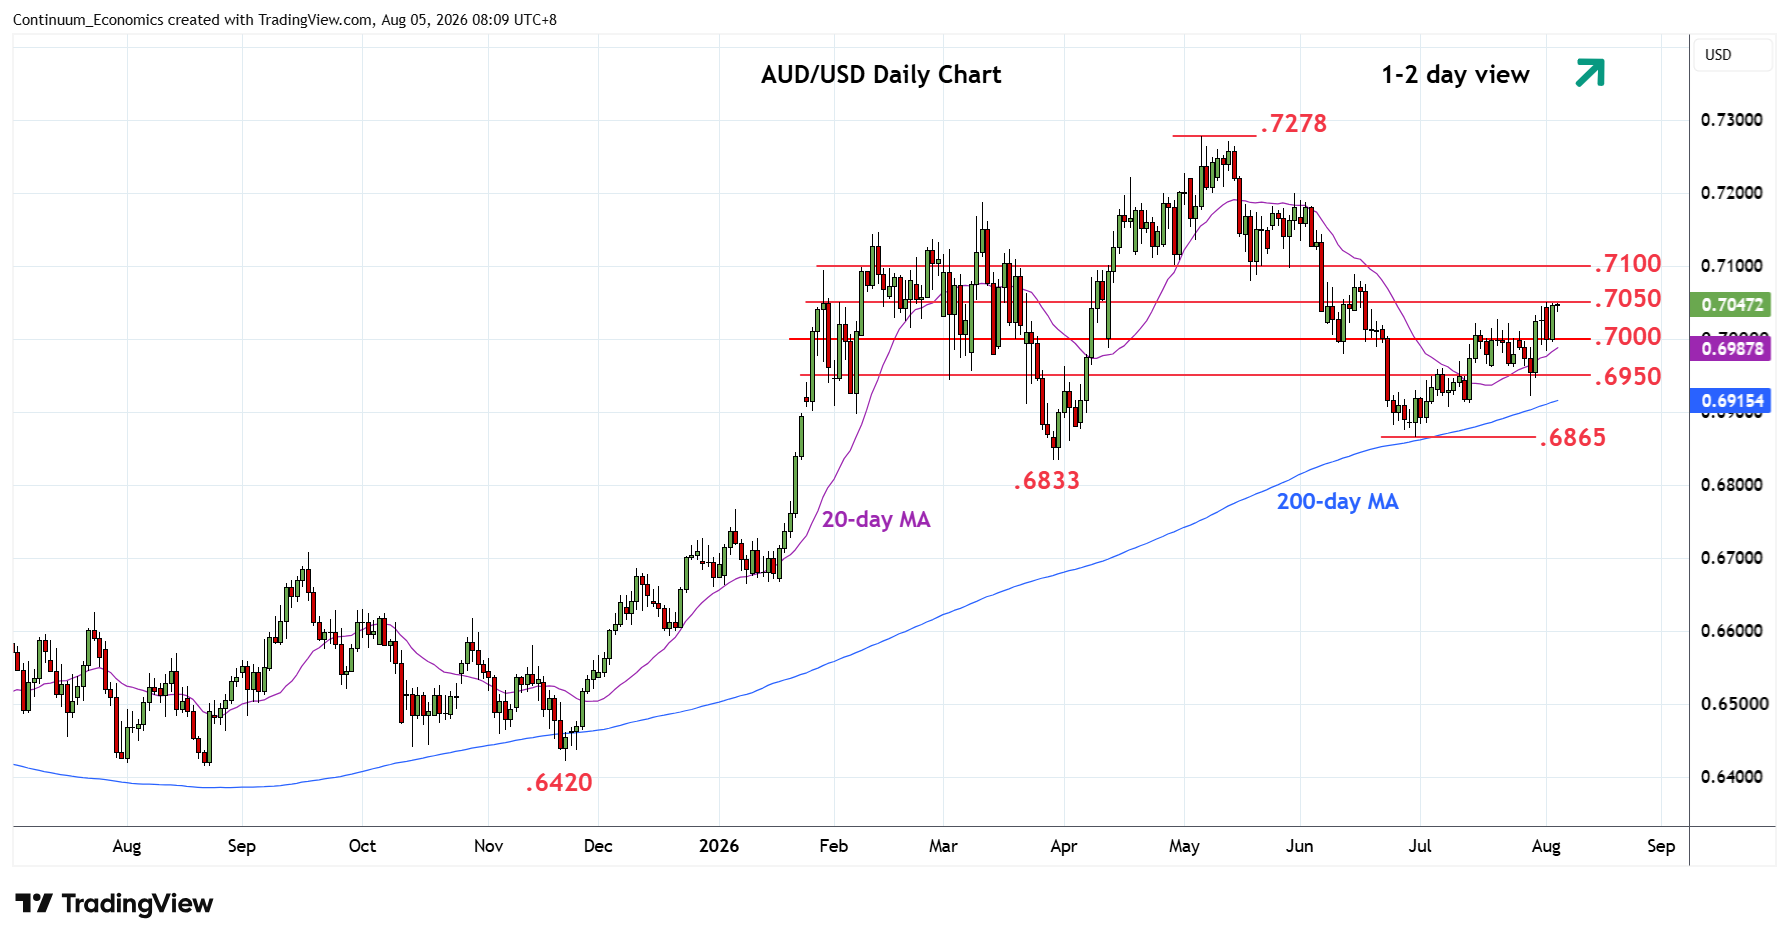
Bounce from support at the .7000 congestion see pressure returning to resistance at the .7050 congestion
| Levels | Imp | Comment | Levels | Imp | Comment | |||
|---|---|---|---|---|---|---|---|---|
| R4 | 0.7120 | * | 61.8% May/Jun fall | S1 | 0.7000 | * | figure, congestion | |
| R3 | 0.7100 | ** | congestion | S2 | 0.6950 | * | congestion | |
| R2 | 0.7080 | * | May low | S3 | 0.6922 | ** | 29 Jul low | |
| R1 | 0.7050 | * | congestion | S4 | 0.6900 | * | congestion |
Asterisk denotes strength of level
00:15 GMT - Bounce from support at the .7000 congestion see pressure returning to resistance at the .7050 congestion. Break here will see room to further retrace the May/June losses and see extension to the 50% Fibonacci retracement at .7070. Just above this see strong resistance coming into play at the .7080/.7100 congestion area. Meanwhile, support at the .7000/.6985 area now underpin. Would take break here to open up room for deeper corrective pullback to support at .6950 congestion and extending to .6922 spike low.