Weekly Chart GBP/USD Update: Turning away from strong resistance
The bounce from the 1.3137/40 current year lows of 24 June - 14 October has extended to test strong resistance at congestion around 1.3400 and the 1.3405 Fibonacci retracement
The bounce from the 1.3137/40 current year lows of 24 June - 14 October has extended to test strong resistance at congestion around 1.3400 and the 1.3405 Fibonacci retracement.
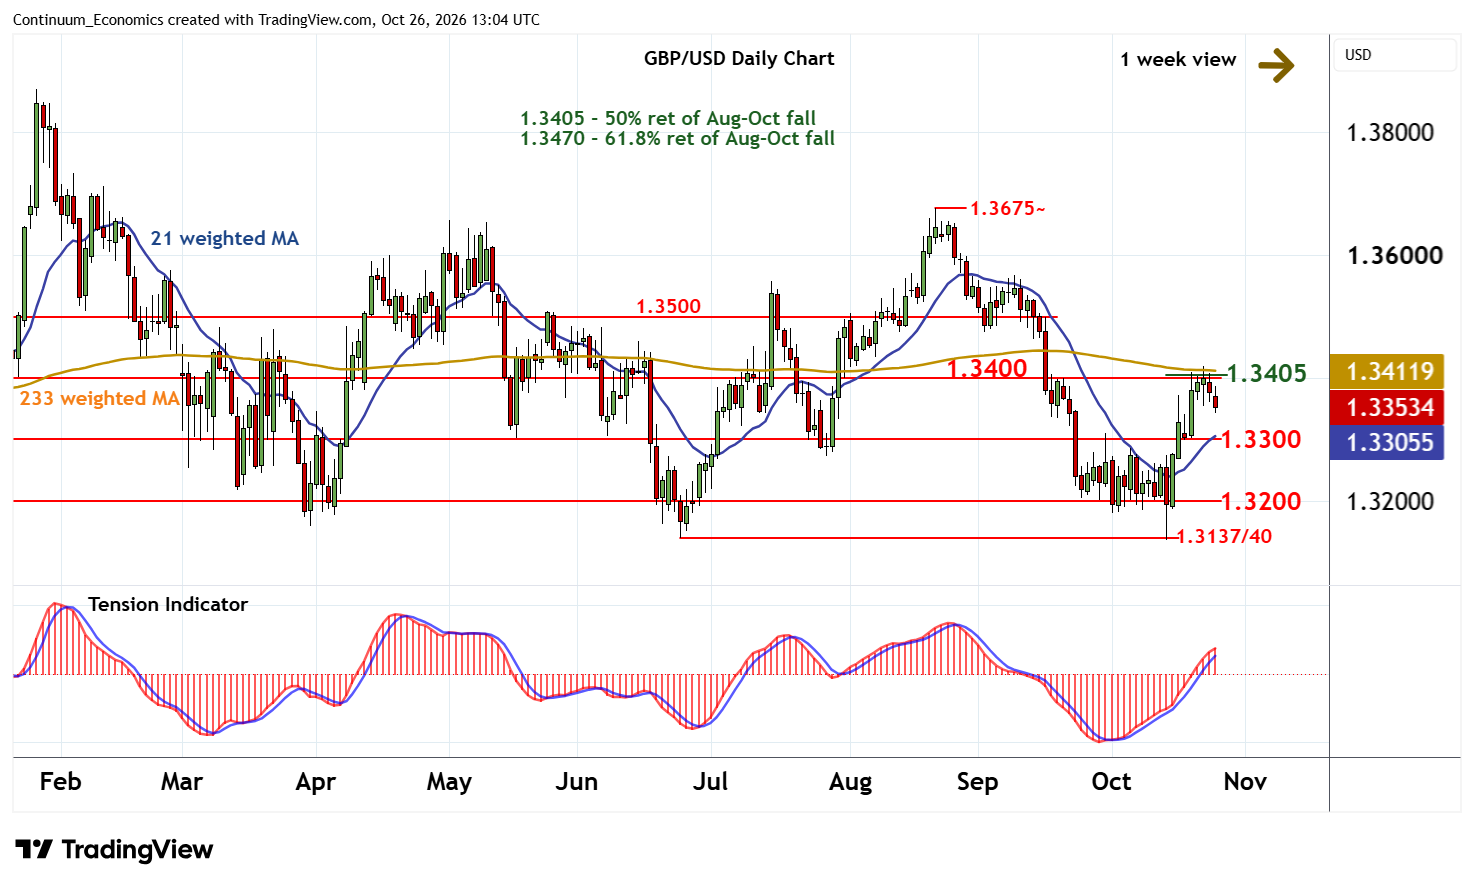
Prices are pulling back from here, as overbought daily stochastics unwind, with immediate focus turning to congestion support at 1.3300. The rising daily Tension Indicator and improving weekly charts suggest any immediate tests could give way to renewed buying interest/consolidation. However, a close beneath here would add weight to sentiment and put prices into range extension above congestion support at 1.3200.
Following corrective trade, fresh gains are looked for.
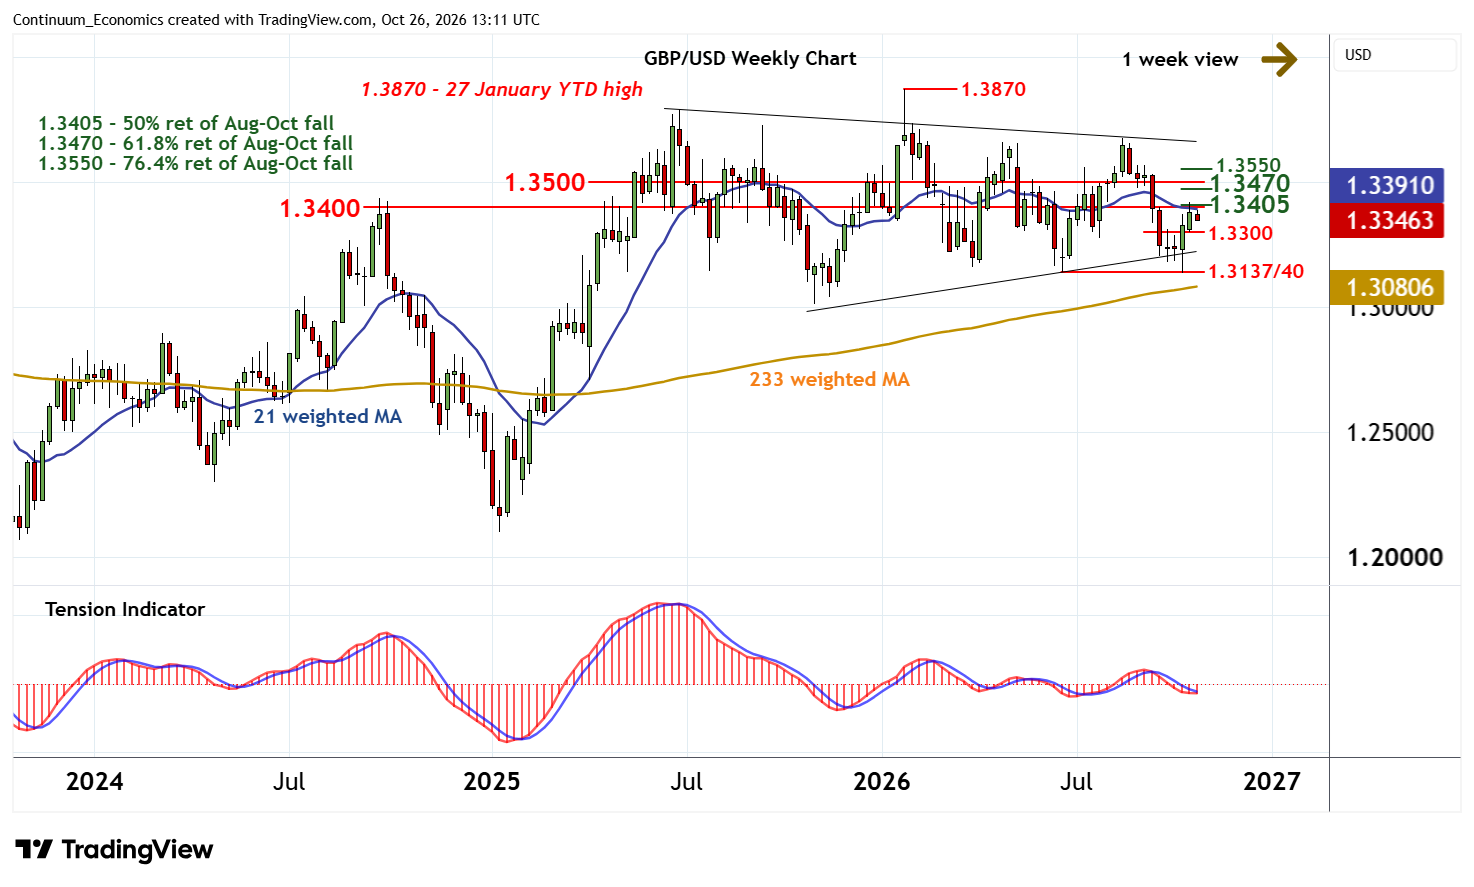
A later close above strong resistance at 1.3400/05 will help to improve sentiment and extend gains from 1.3137/40 towards the 1.3470 Fibonacci retracement. Continuation beyond here will further improve sentiment and open up the 1.3550 retracement, via congestion around 1.3500.