Published: 2026-08-24T00:42:51.000Z
Chart NZD/USD Update: Within reach of .5995, May high
1
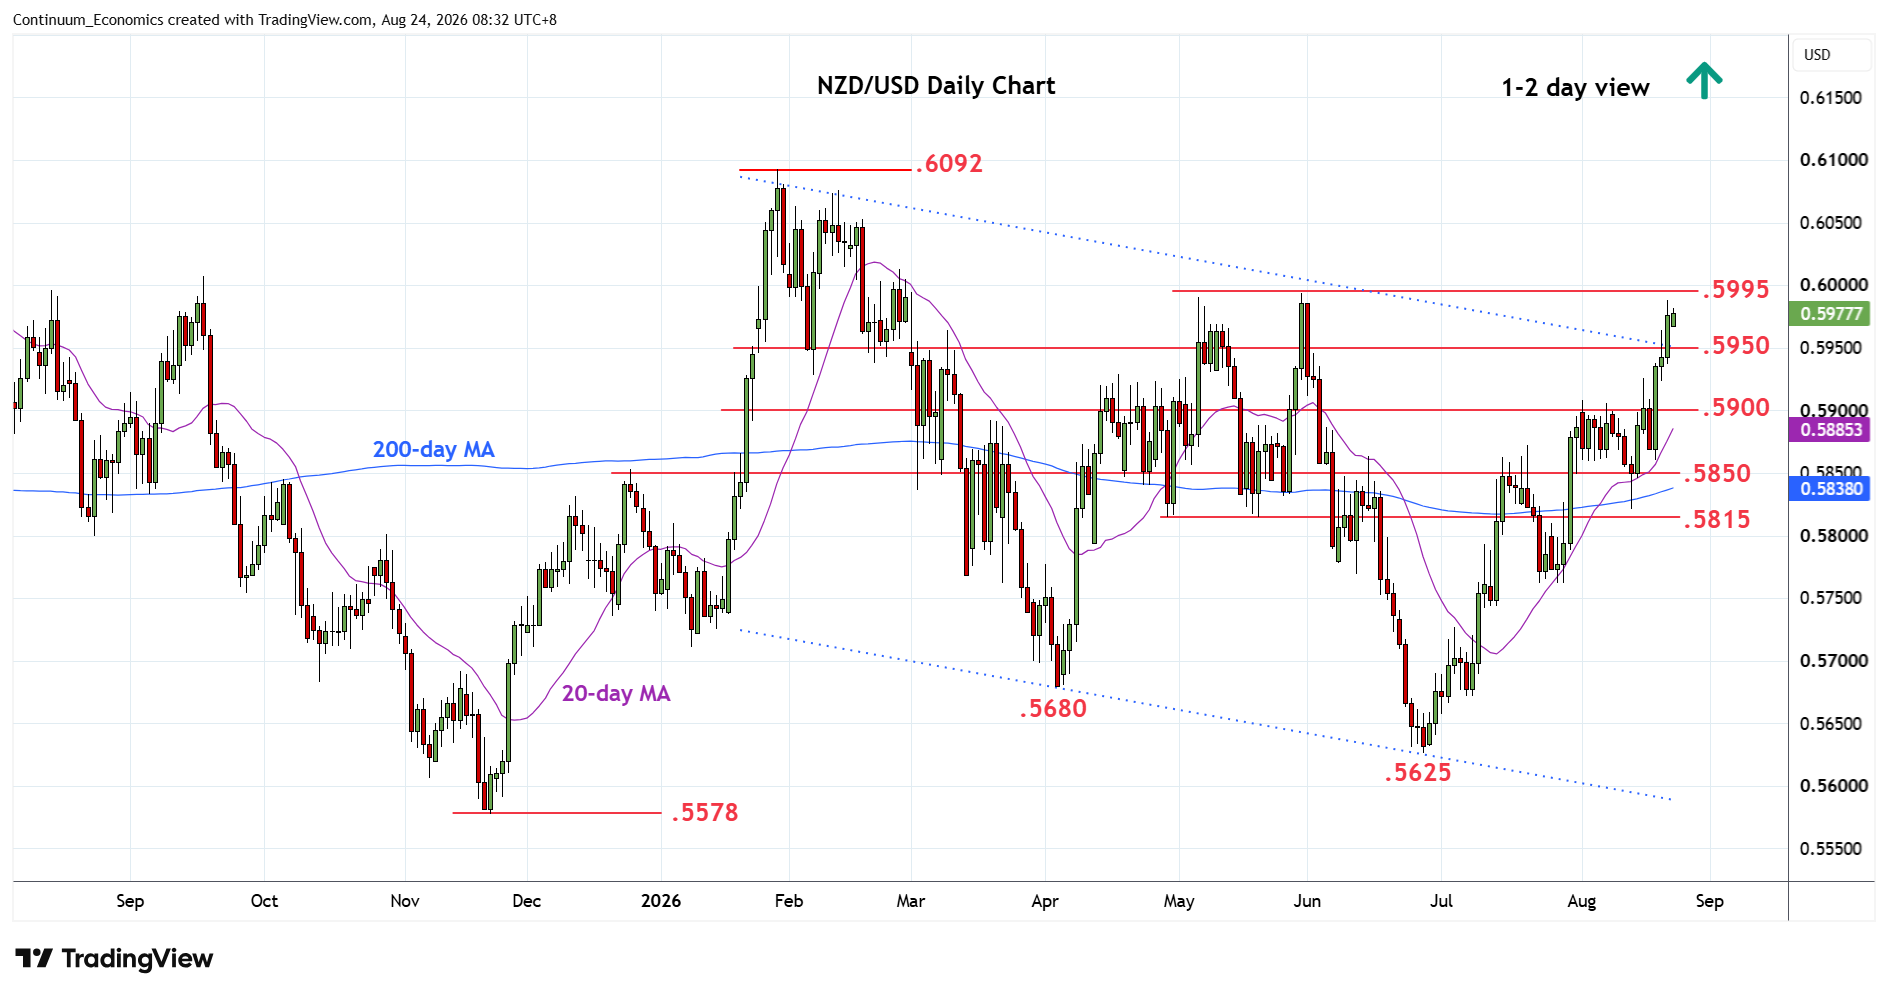
Sharp rally last week see prices extending bullish gains from the .5625 June current year low to reach .5988 high
| Levels | Imp | Comment | Levels | Imp | Comment | |||
|---|---|---|---|---|---|---|---|---|
| R4 | .6092 | ** | 29 Jan YTD high | S1 | .5950 | * | congestion | |
| R3 | .6050 | * | congestion | S2 | .5900 | * | congestion | |
| R2 | .6000/13 | * | congestion, 26 Feb high | S3 | .5850 | * | congestion | |
| R1 | .5995 | ** | May high | S4 | .5815 | ** | May low |
Asterisk denotes strength of level
00:35 GMT - Sharp rally last week see prices extending bullish gains from the .5625 June current year low to reach .5988 high. Bullish momentum keep pressure on the upside and see room to target the May high at .5995 then the .6000 figure. Would expect reaction here as daily and weekly studies extend into overbought areas. A later break will see room o the .6050 congestion but potential will be for extension to .6092 January YTD high. Meanwhile, support remains at the .5950 level which should underpin and sustain bullish bounce from the recent .5860/.5820, 19/13 August higher lows.