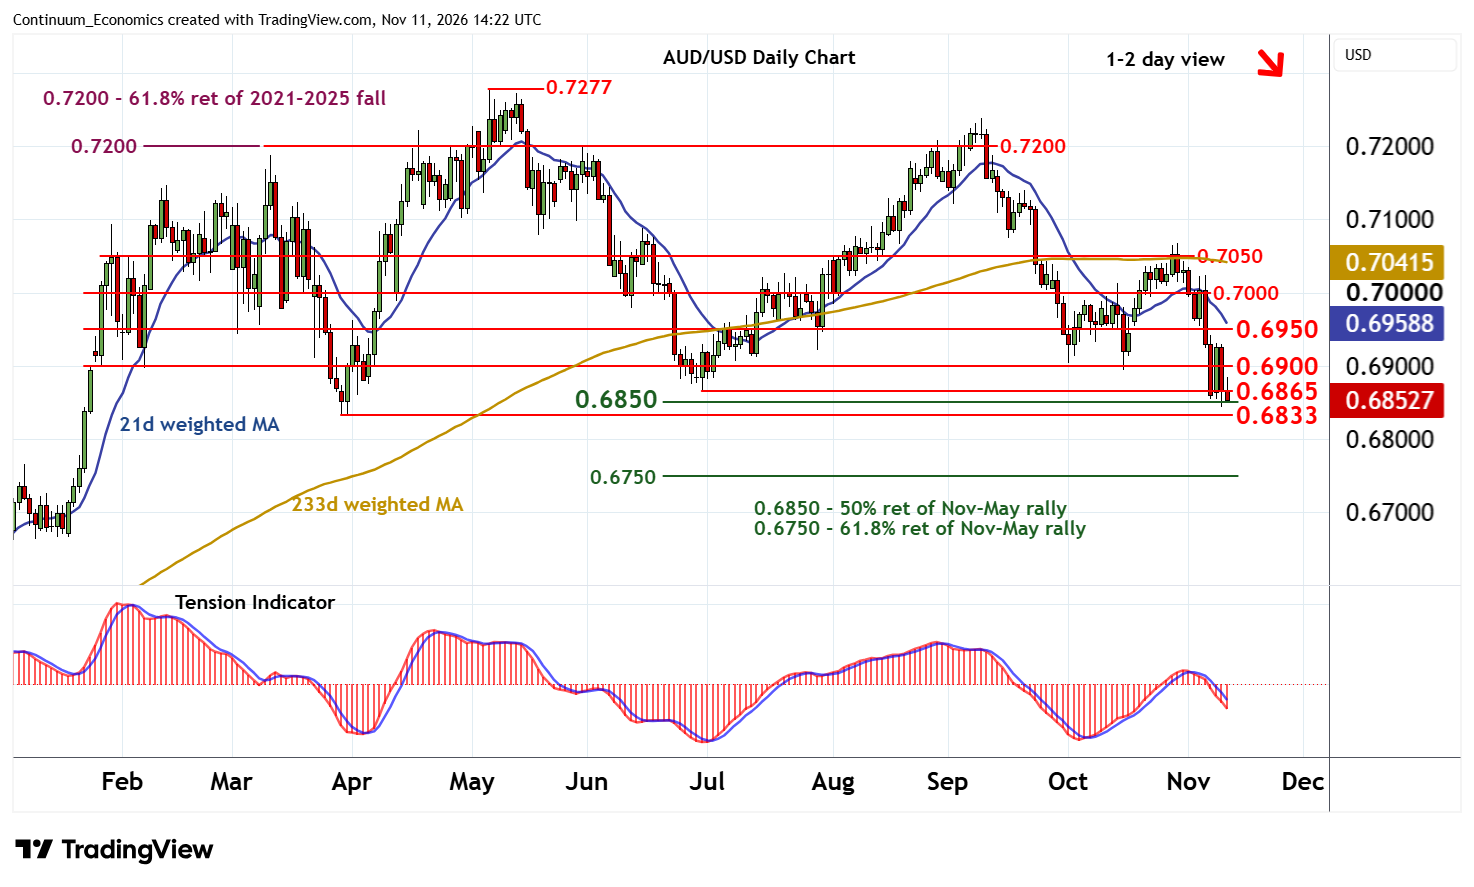
Chart AUD/USD Update: Pressuring support - background studies bearish
Little change, as prices extend (choppy) trade at support at the 0.6850 Fibonacci retracement and the 0.6865 monthly low of 30 June
| Levels | Imp | Comment | Levels | Imp | Comment | |||
|---|---|---|---|---|---|---|---|---|
| R4 | 0.7050 | * | congestion | S1 | 0.6865 | ** | 30 Jun (m) low | |
| R3 | 0.7000 | * | congestion | S2 | 0.6850 | ** | 50% ret of Nov-May rally | |
| R2 | 0.6950 | * | break level | S3 | 0.6833 | ** | 30-31 Mar (m) lows | |
| R1 | 0.6900 | ** | congestion | S4 | 0.6800 | break level |
Asterisk denotes strength of level
14:15 GMT - Little change, as prices extend (choppy) trade at support at the 0.6850 Fibonacci retracement and the 0.6865 monthly low of 30 June. Intraday studies are bearish and the daily Tension Indicator is under pressure, highlighting room for a break towards the 0.6833 monthly lows from late-March. However, flat oversold daily stochastics could limit any initial tests in fresh consolidation, before bearish weekly charts prompt a break. A close beneath here will confirm continuation of losses from the 0.7277 current year high of 6 May, initially to 0.6800..
Meanwhile, resistance remains at congestion around 0.6900. An unexpected close above here will help to stabilise price action and prompt consolidation beneath 0.6950.