Published: 2026-10-19T00:27:38.000Z
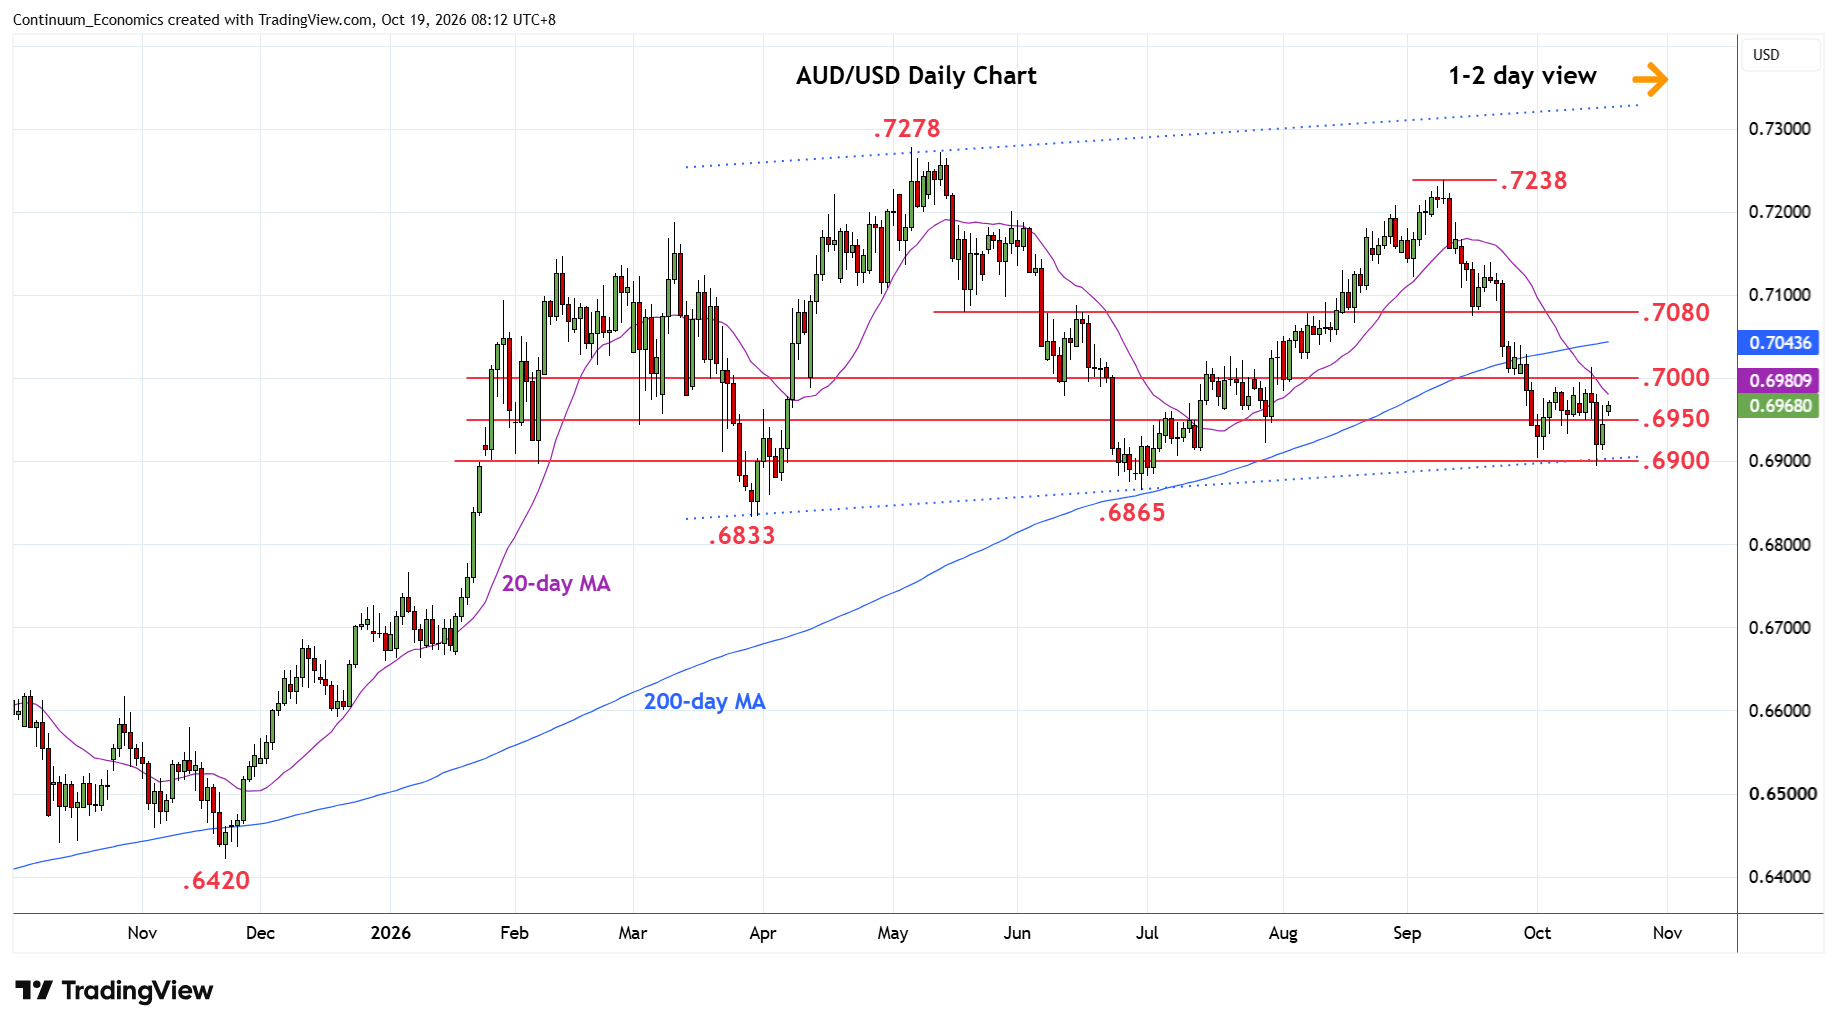
Chart AUD/USD Update: Higher in range from .6900 support
1
Turned back up in range from retest of the .6900 level as prices consolidate losses from the .7238, September high
| Levels | Imp | Comment | Levels | Imp | Comment | |||
|---|---|---|---|---|---|---|---|---|
| R4 | 0.7100 | * | congestion | S1 | 0.6950 | * | congestion | |
| R3 | 0.7080 | ** | May low, congestion | S2 | 0.6900 | * | congestion, channel | |
| R2 | 0.7050 | * | congestion | S3 | 0.6865 | ** | Jun low | |
| R1 | 0.7000 | * | congestion | S4 | 0.6833 | ** | Mar low |
Asterisk denotes strength of level
00:20 GMT - Turned back up in range from retest of the .6900 level as prices consolidate losses from the .7238, September high. Daily studies have turned higher to unwind oversold reading and regaining the .6950 congestion suggest scope for retest of the .7000 level. Above the latter will revive upside focus and see room for stronger gains to retrace losses from the September high towards .7050 congestion then the strong resistance at .7080/.7100 area. Meanwhile, support at the .6950/.6900 congestion area should underpin.