Published: 2026-09-24T00:47:34.000Z
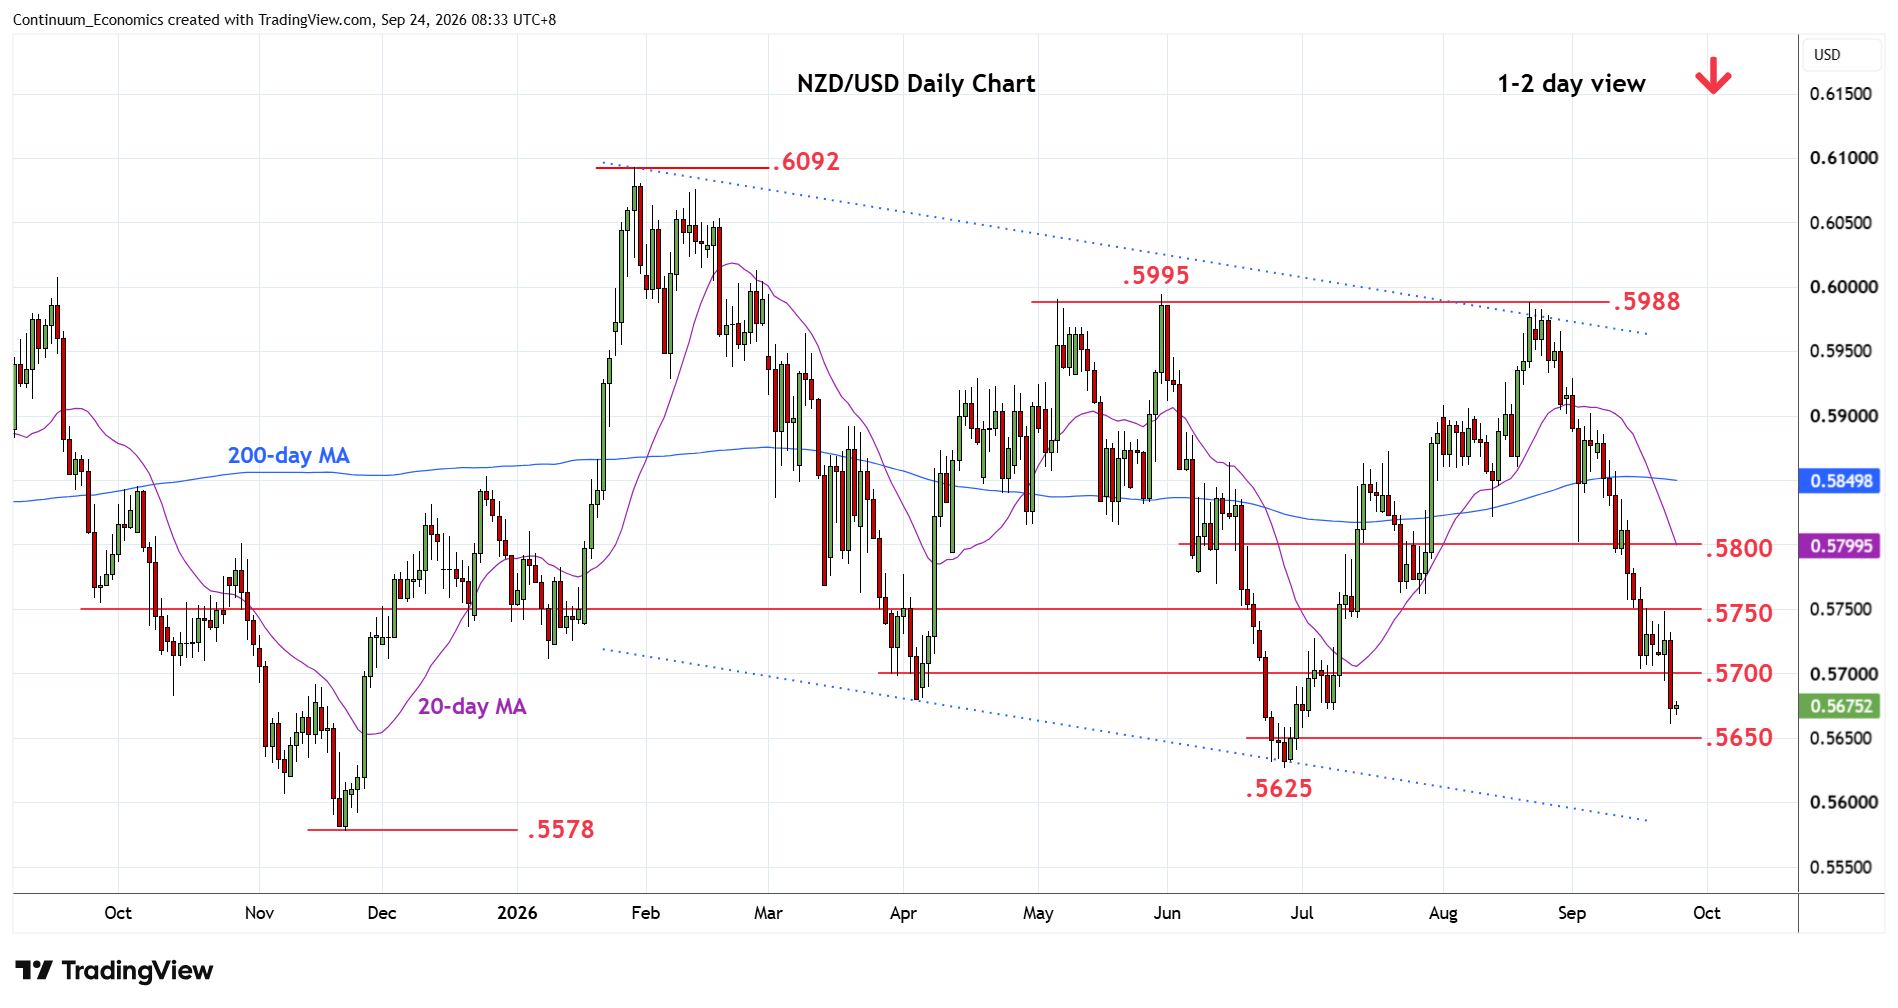
Chart NZD/USD Update: Within reach of .5625, June YTD low
5
Choppy trade within the .5750/.5700 range area has given way to break to reach .5660 low
| Levels | Imp | Comment | Levels | Imp | Comment | |||
|---|---|---|---|---|---|---|---|---|
| R4 | .5850 | ** | congestion, 200-day MA | S1 | .5650 | * | congestion | |
| R3 | .5800 | ** | congestion | S2 | .5625 | ** | 26 Jun YTD low | |
| R2 | .5750 | * | congestion | S3 | .5600 | * | congestion | |
| R1 | .5700 | * | congestion | S4 | .5578 | ** | Nov 2025 low |
Asterisk denotes strength of level
00:40 GMT - Choppy trade within the .5750/.5700 range area has given way to break to reach .5660 low. Daily studies are stretched but pressure remains on the downside and see room for further losses to target the nearby .5650 congestion then the .5625, June current year low. Would expect reaction here but a later break cannot be ruled out to extend the broad losses from the .6092, January current year high. Meanwhile, resistance at the .5700 level and extending to .5650 congestion now expected to cap. Only above here will ease the downside pressure and see room for stronger bounce to .5800 resistance.