Published: 2026-06-19T12:12:02.000Z
Chart USD/ZAR Update: Edging higher
-
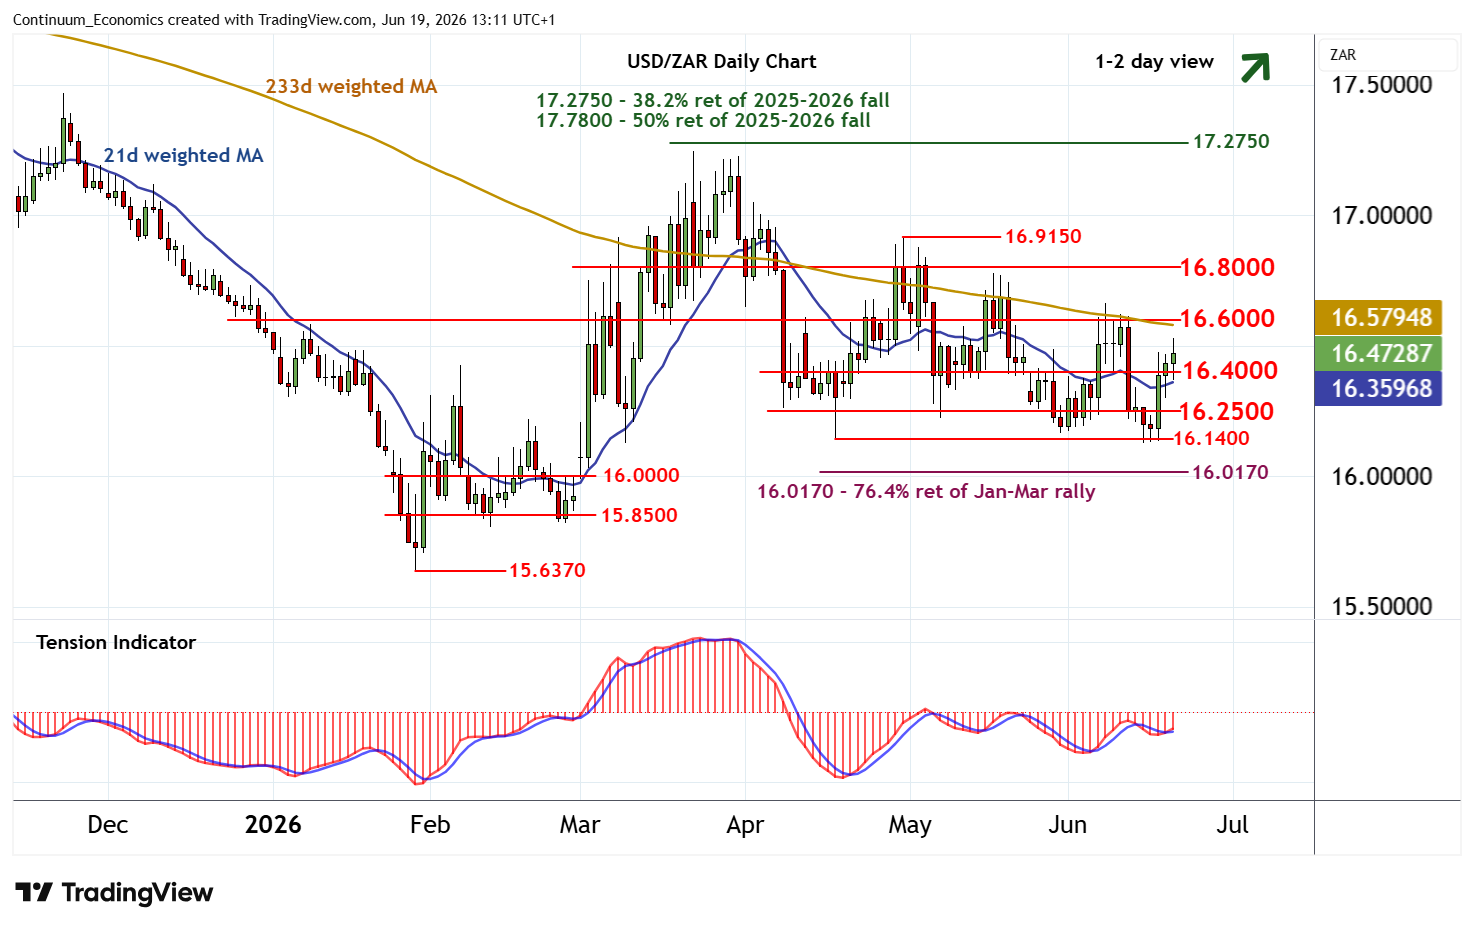
The bounce to 16.4000 has extended
| Level | Comment | Level | Comment | |||||
|---|---|---|---|---|---|---|---|---|
| R4 | 16.9150 | ** | 30 Apr (w) high | S1 | 16.4000 | congestion | ||
| R3 | 16.8000 | ** | congestion | S2 | 16.2500 | * | congestion | |
| R2 | 16.6630 | 8 Jun (w) high | S3 | 16.1400 | ** | 17 Apr (m) low | ||
| R1 | 16.6000 | * | congestion | S4 | 16.0170 | ** | 76.4% ret of Jan-Mar rally |
Asterisk denotes strength of level
12:50 BST - The bounce to 16.4000 has extended, with prices currently trading around 16.4750. Rising daily readings highlight room for continuation towards congestion resistance at 16.6000. But negative weekly charts should limit any initial tests in fresh consolidation. A close above here, however, will target congestion around 16.8000, where more significant reactions are expected to appear. Meanwhile, a close back below congestion support at 16.4000 would stabilise sentiment and prompt consolidation above 16.2500.