Published: 2026-10-05T00:47:17.000Z
Chart NZD/USD Update: Turned up from .5585 fresh year low
2
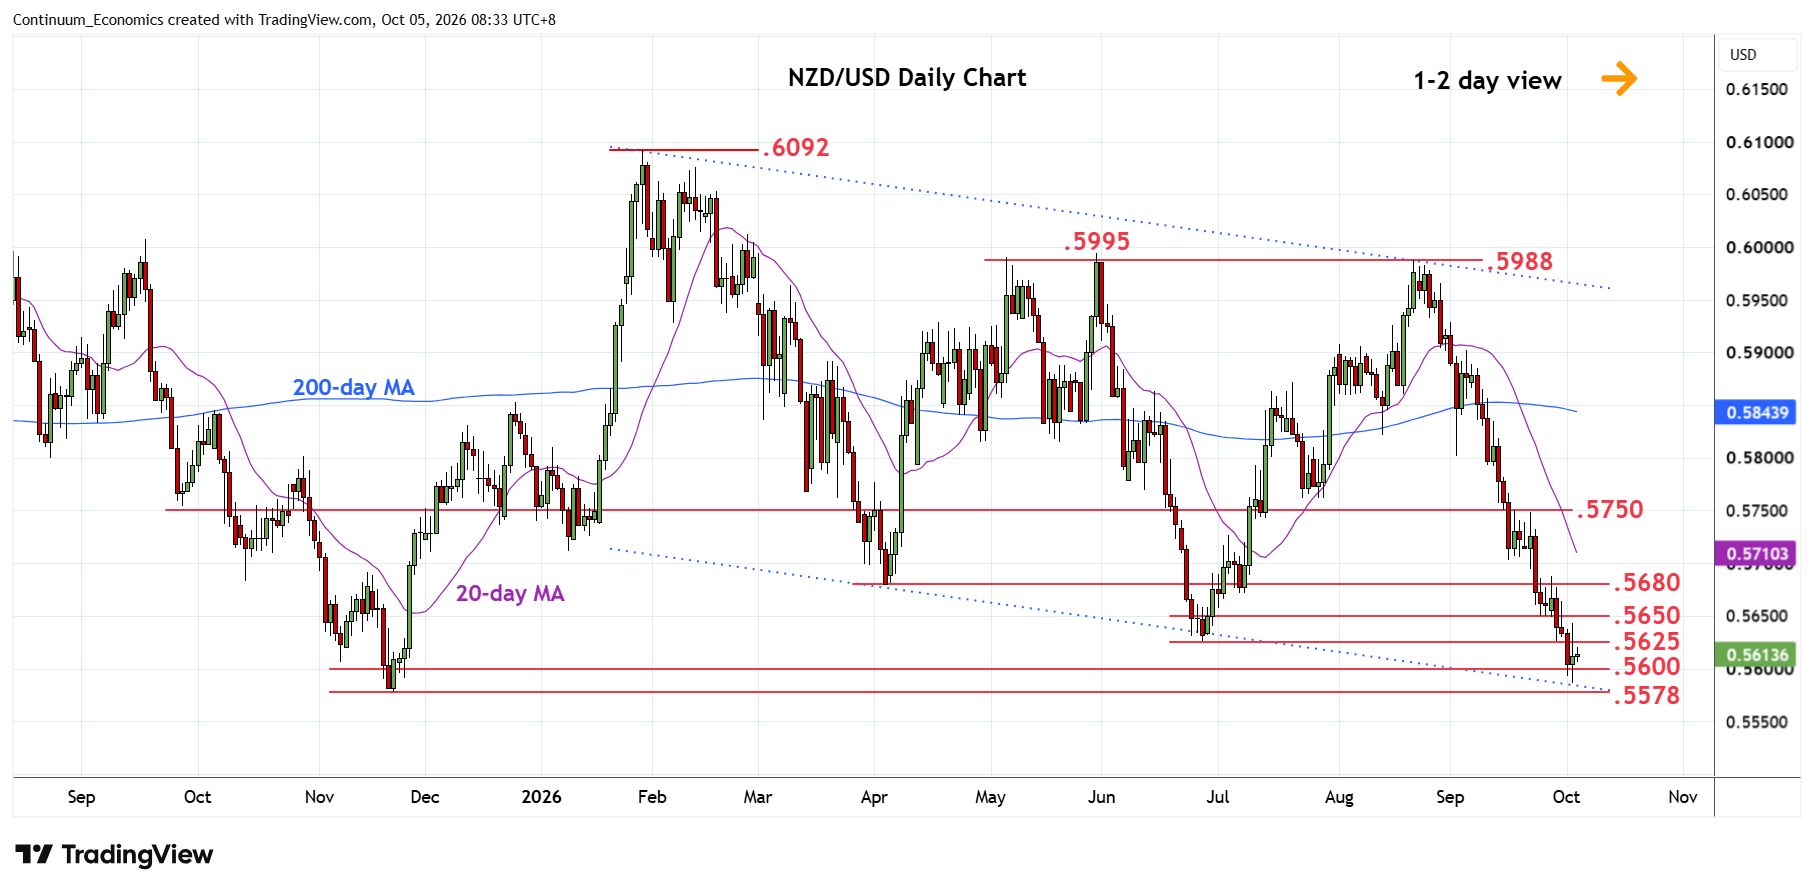
No follow-through on break of the .5600 level as prices turned up from fresh year low at .5585
| Levels | Imp | Comment | Levels | Imp | Comment | |||
|---|---|---|---|---|---|---|---|---|
| R4 | .5700 | * | congestion | S1 | .5600 | * | congestion | |
| R3 | .5680 | ** | Apr low | S2 | .5585 | ** | 2 Oct YTD low | |
| R2 | .5650 | * | congestion | S3 | .5578 | ** | Nov 2025 low | |
| R1 | .5625 | * | Jun low | S4 | .5550 | * | congestion |
Asterisk denotes strength of level
00:40 GMT - No follow-through on break of the .5600 level as prices turned up from fresh year low at .5585. Bounce see prices unwinding oversold intraday and daily studies following sharp losses from the .5988 August high. Weekly studies are stretched as well and suggest scope for corrective bounce to resistance starting at the .5625 June low. Above here will open up room for stronger gains to .5650 congestion then the .5680, April low. Meanwhile, support is at the .5600 congestion. Would take close below this to expose the .5585/.5578 current year low and November 2025 low to retest.