Published: 2026-06-23T10:53:03.000Z
Chart EUR/CHF Update: Leaning lower
-
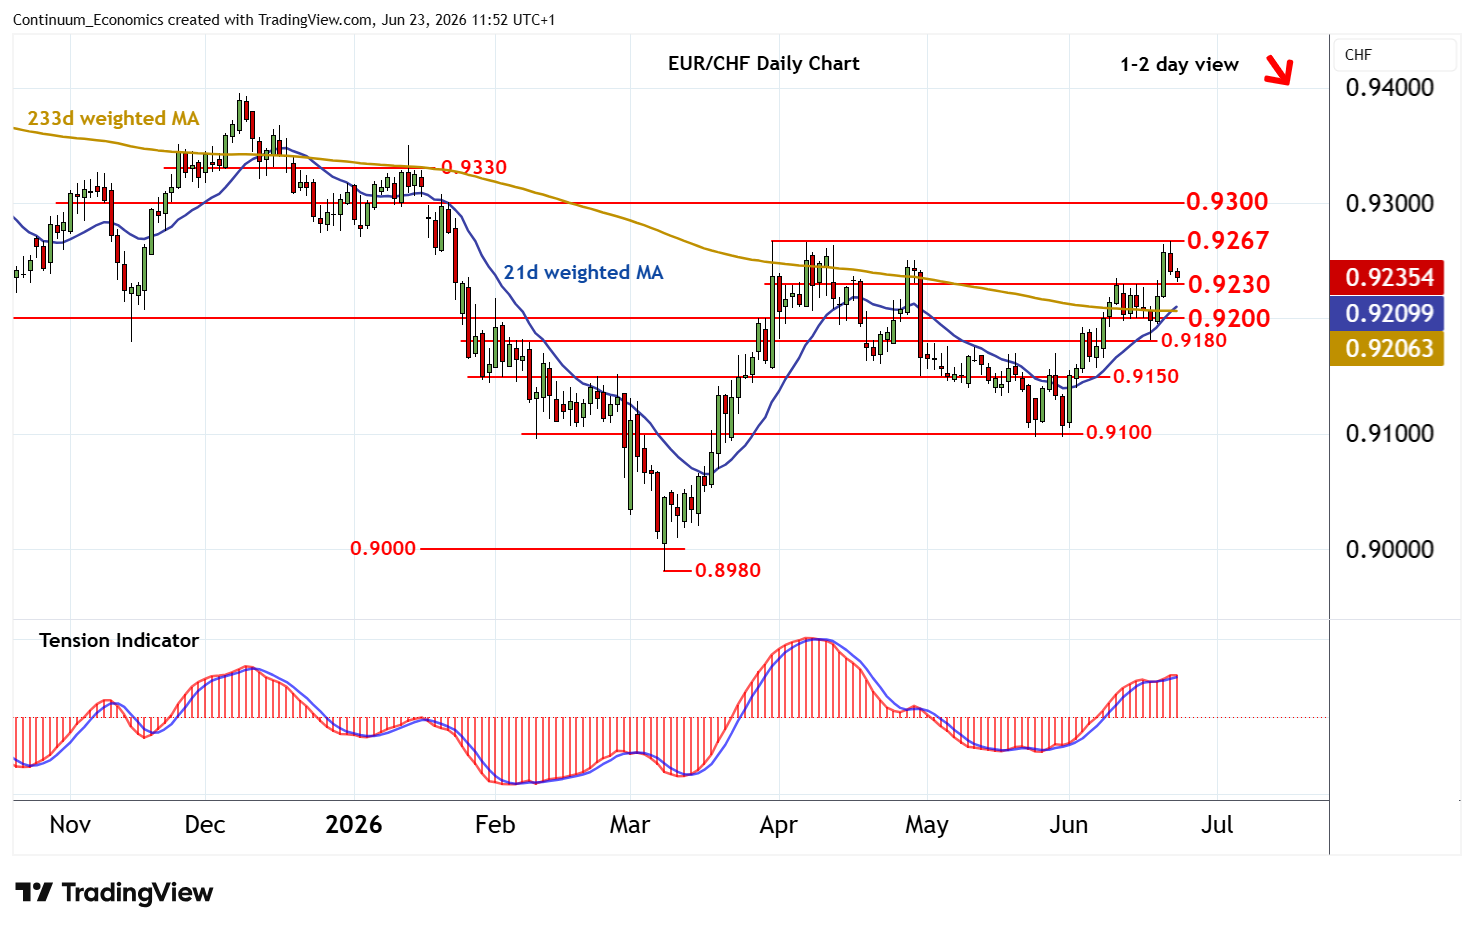
Consolidation around 0.9250 has given way to a break down to congestion support at 0.9230
| Level | Comment | Level | Comment | |||||
|---|---|---|---|---|---|---|---|---|
| R4 | 0.9350 | * | 14 Jan YTD high, congestion | S1 | 0.9230 | congestion | ||
| R3 | 0.9330 | * | range highs | S2 | 0.9200 | ** | break level | |
| R2 | 0.9300 | ** | congestion | S3 | 0.9180 | ** | congestion | |
| R1 | 0.9267 | ** | 31 Mar (m) high | S4 | 0.9150 | ** | congestion |
Asterisk denotes strength of level
11:30 BST - Consolidation around 0.9250 has given way to a break down to congestion support at 0.9230, where flat oversold intraday studies are prompting fresh consolidation. Daily stochastics are turning down and the positive daily Tension Indicator is flattening, suggesting room for a break beneath here towards 0.9200. However, positive weekly charts should limit any tests in renewed consolidation/buying interest. Meanwhile, resistance remains ast the 0.9267 monthly high of 31 March. A close above here would turn sentiment positive and confirm continuation of March gains, initially towards congestion around 0.9300.