Weekly Chart USD Index DXY: Pullback from fresh year highs - background studies remain positive
Consolidation above 102.00 has given way to fresh year highs
Consolidation above 102.00 has given way to fresh year highs,
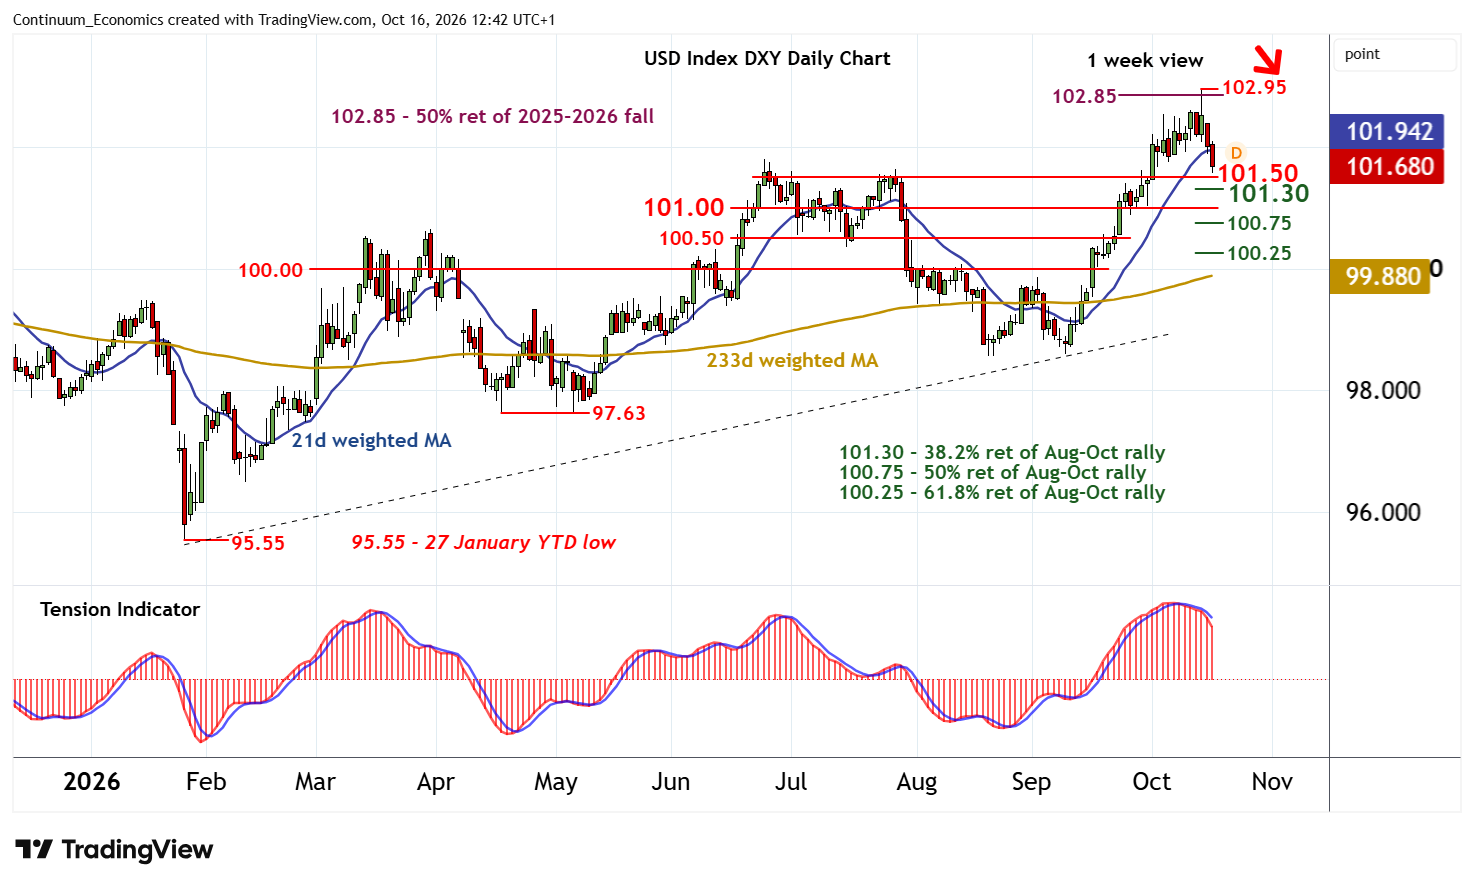
with gains from the 95.55 current year low of 27 January testing above strong resistance at the 102.85 multi-month Fibonacci retracement to reach 102.95.
Unwinding overbought daily stochastics and a reversal lower in the daily Tension Indicator has turned near-term sentiment bearish and prompted a break below 102.00 towards congestion support at 101.50. A close beneath here will add fresh weight to already bearish price action and open up the 101.30 Fibonacci retracement. Beneath here is 101.00. But daily stochastics are already oversold and broader weekly charts are positive, suggesting any deeper retracement should be limited in short-covering/consolidation towards the 100.75 retracement.
Meanwhile, resistance is lowered to the 101.50 break level.
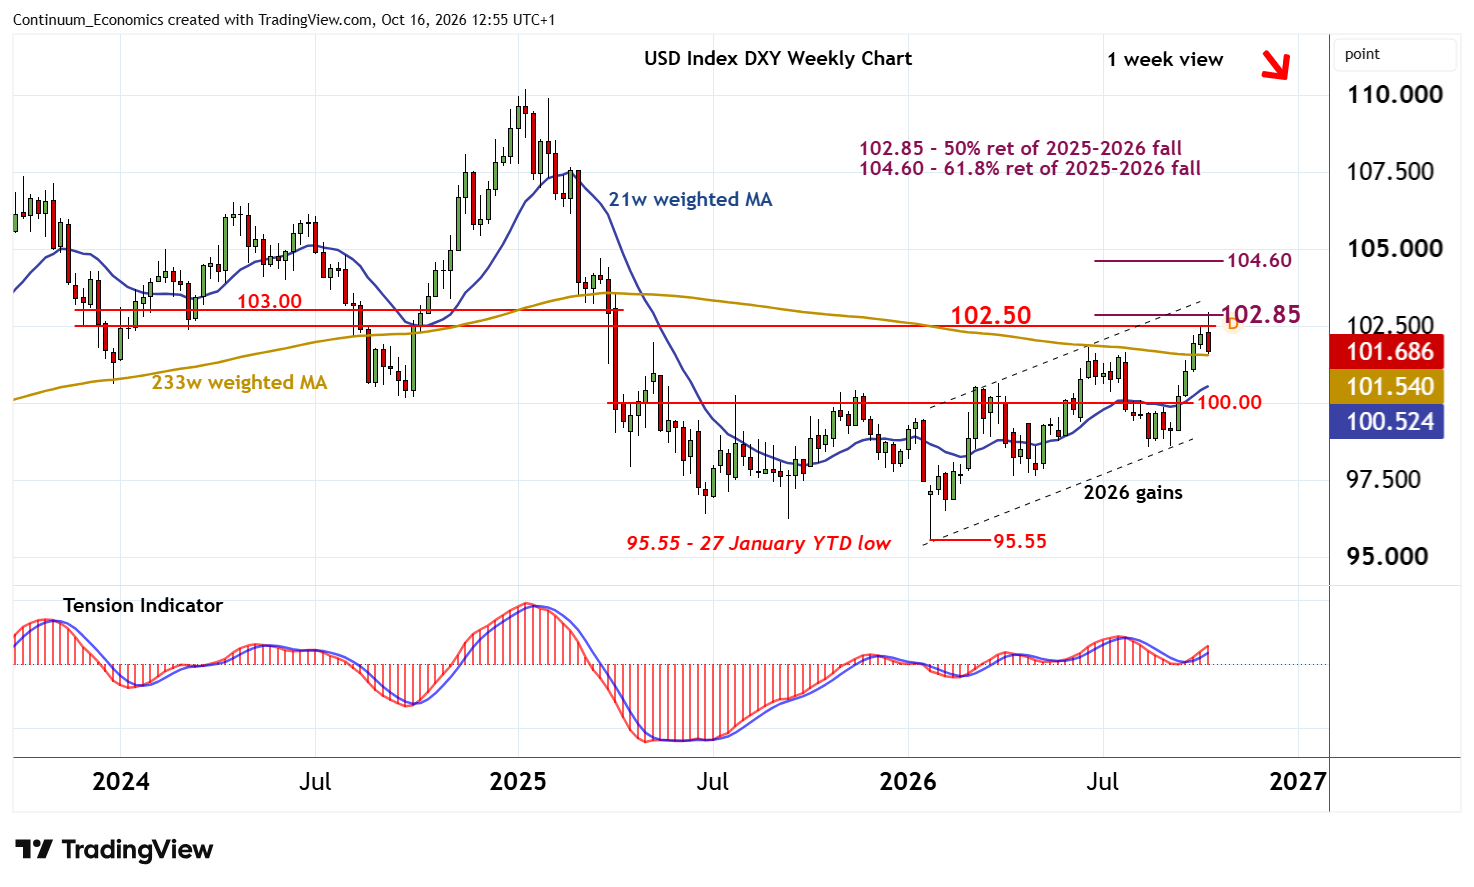
A close back above here, not yet seen, will help to stabilise price action. Longer-term charts are also positive. But a close above 102.85 is needed to turn sentiment positive and confirm continuation of January gains beyond congestion around 103.00. Longer-term focus will then turn to the 104.60 retracement.