Published: 2026-06-17T00:56:14.000Z
Chart USD/JPY Update: Higher in range towards 160.60
1
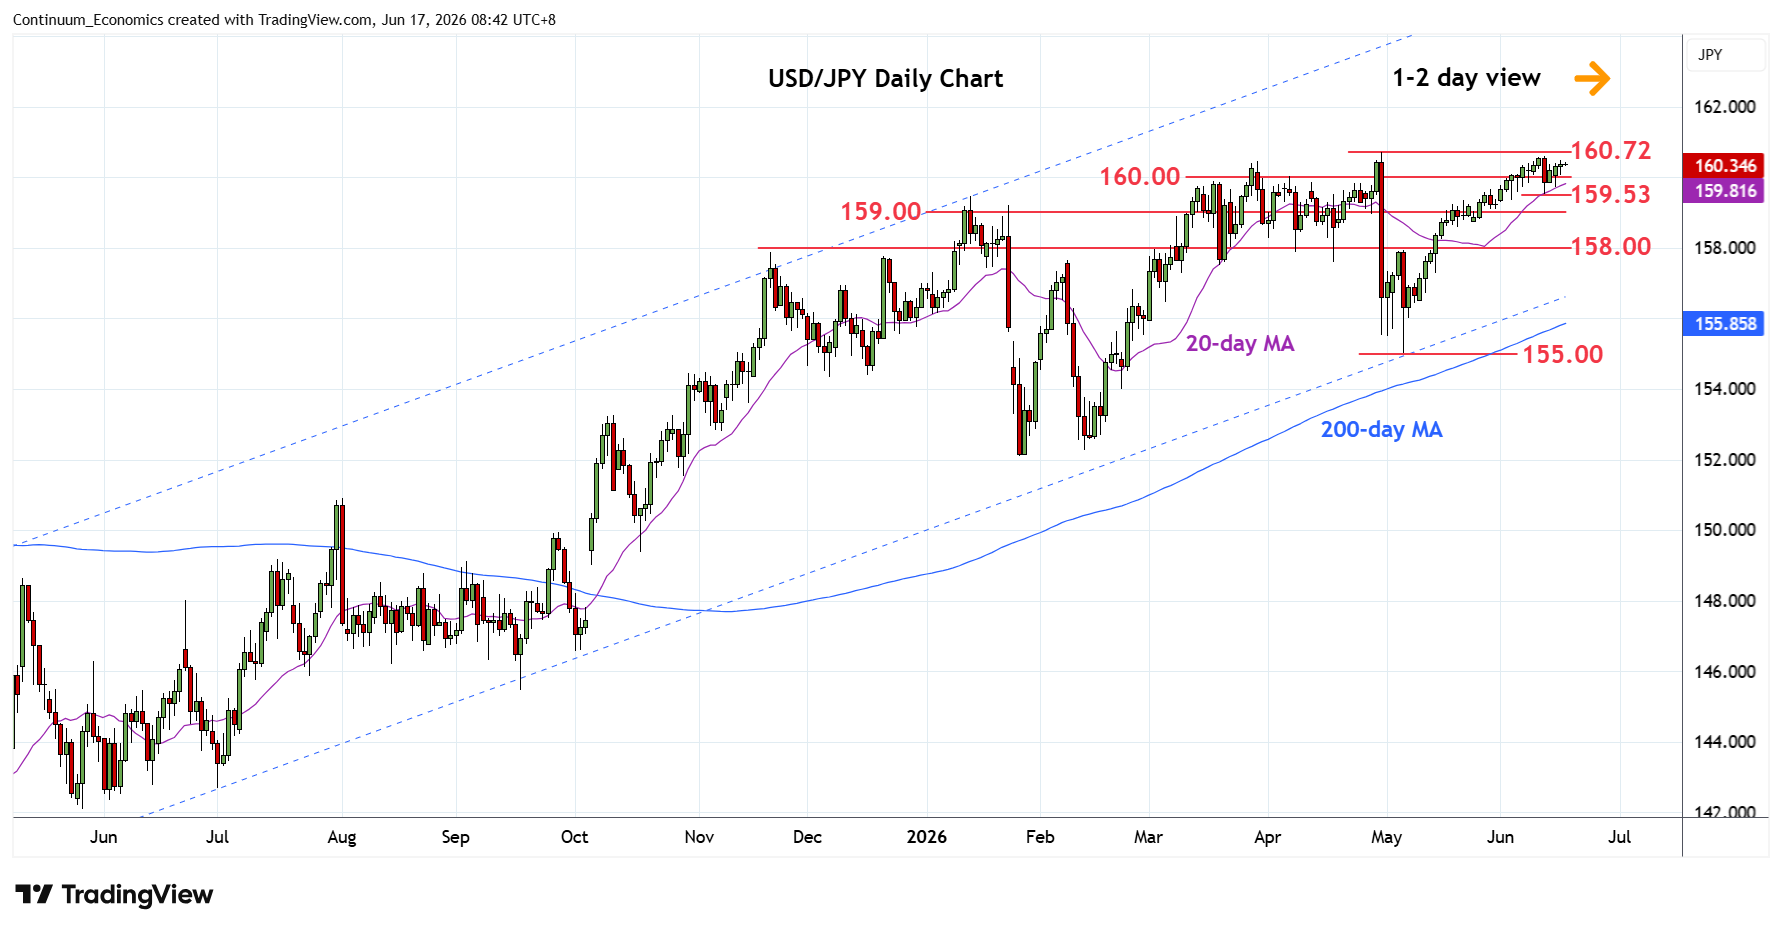
Edging higher in range from the 159.53 low of last week and gains above the 160.00 level see room to retest the 160.60 high
| Levels | Imp | Comment | Levels | Imp | Comment | |||
|---|---|---|---|---|---|---|---|---|
| R4 | 161.95 | ** | Jul 2024 multi-year high | S1 | 159.53 | * | 11 Jun low | |
| R3 | 161.00 | * | figure | S2 | 159.00 | * | congestion | |
| R2 | 160.72 | ** | 30 Apr YTD high | S3 | 158.60 | * | 18 May low | |
| R1 | 160.60 | * | 11 Jun high | S4 | 158.00 | ** | congestion |
Asterisk denotes strength of level
00:50 GMT - Edging higher in range from the 159.53 low of last week and gains above the 160.00 level see room to retest the 160.60 high. However, mixed daily studies suggest resistance here and the 160.72 30 April current year high are expected to cap. Break here, if seen, will extend the broader gains from 2024 year low and see room towards 161.95, July 2024 multi-year high. Meanwhile, support is at the 159.53 low and see break here needed to open up room for deeper pullback to retrace strong gains from the 155.00 May low to support at the 159.00/158.60 congestion and 18 May low.