Published: 2026-07-03T01:59:37.000Z
Chart GBP/USD Update: Consolidating below 1.3400, higher later
1
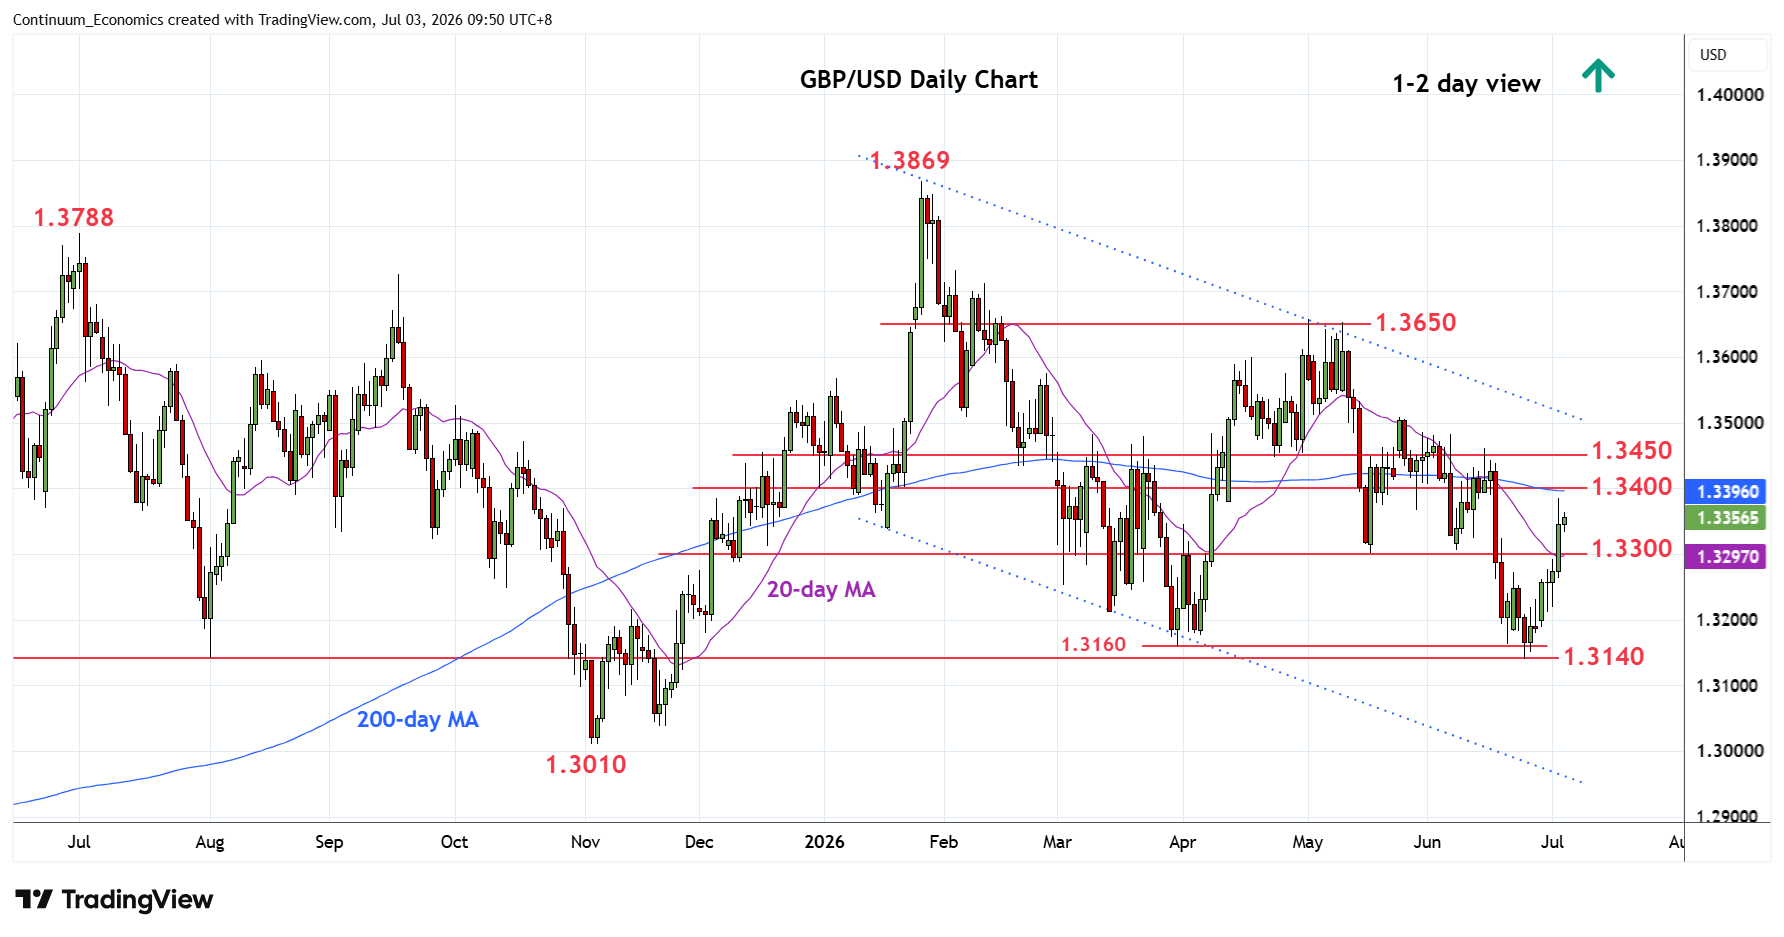
Sharply higher, as break above the 1.3300 resistance has seen gains to approach the 1.3400 level
| Level | Comment | Level | Comment | |||||
|---|---|---|---|---|---|---|---|---|
| R4 | 1.3550 | * | congestion | S1 | 1.3300 | ** | May low | |
| R3 | 1.3500/10 | ** | congestion, 25 May high | S2 | 1.3250 | * | congestion | |
| R2 | 1.3450/60 | * | congestion, 15 Jun high | S3 | 1.3200 | * | congestion | |
| R1 | 1.3400 | * | congestion | S4 | 1.3140 | ** | 24 Jun YTD low |
Asterisk denotes strength of level
01:50 GMT - Sharply higher, as break above the 1.3300 resistance has seen gains to approach the 1.3400 level. Consolidation here see prices unwinding the stretched intraday studies but this is expected to give way to break to extend gains from the 1.3140, 24 June current year low. Higher will see room to resistance at the 1.3450/60 area then 1.3500/10, 25 May high and January trendline. Meanwhile, support is raised to the 1.3300 May low which should now underping and sustain strong gains from the June YTD low.