Chart USD/JPY Update: Under pressure in both USD- and JPY-driven trade
Cautious trade has given way to a sharp break lower in both USD- and JPY-driven trade
| Levels | Imp | Comment | Levels | Imp | Comment | |||
|---|---|---|---|---|---|---|---|---|
| R4 | 165.00 | ** | figure | S1 | 162.50 | * | congestion | |
| R3 | 164.50 | ** | November 1986 high | S2 | 162.00 | * | congestion | |
| R2 | 163.95 | ** | December 1986 high | S3 | 161.50 | * | congestion | |
| R1 | 163.00 | congestion | S4 | 160.72 | * | 30 Apr (m) high |
Asterisk denotes strength of level
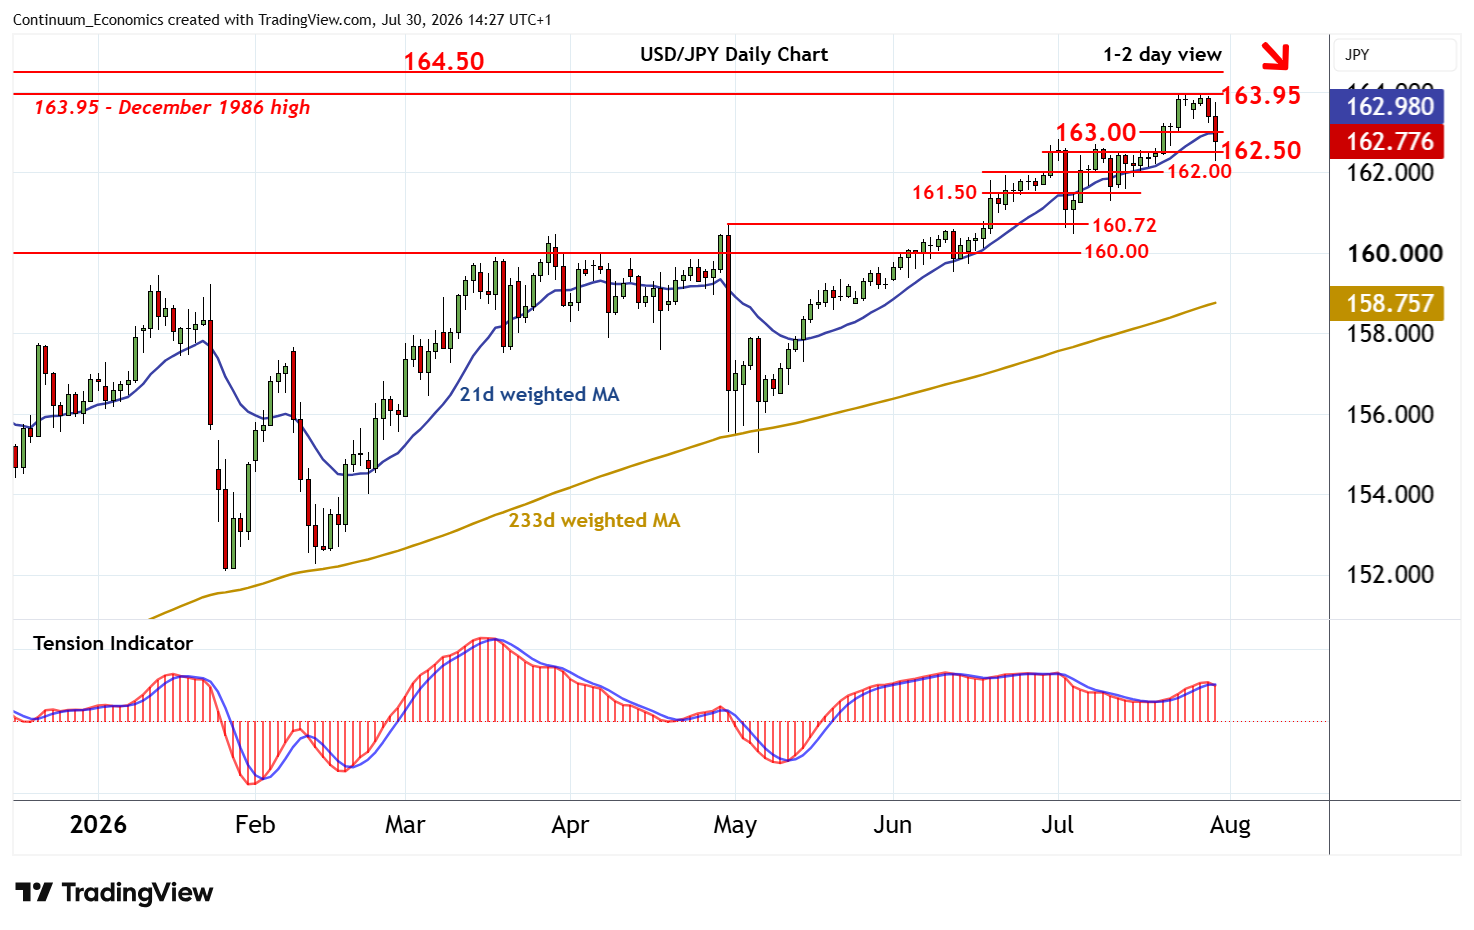
13:45 BST - Cautious trade has given way to a sharp break lower in both USD- and JPY-driven trade, with prices testing below 162.50 before bouncing back into consolidation beneath 163.00. Daily readings are under pressure and positive weekly charts are turning mixed/negative, suggesting room for deeper losses in the coming sessions. A close below 162.50 will put prices into consolidation above congestion around 162.00, with room for still deeper losses to follow. Meanwhile, a close back above congestion resistance at 163.00 will help to stabilise price action and prompt consolidation beneath strong resistance at the 163.95 high of December 1986.