Published: 2026-06-22T01:53:20.000Z
Chart GBP/USD Update: Tunred up from retest of 1.3160 March YTD low
2
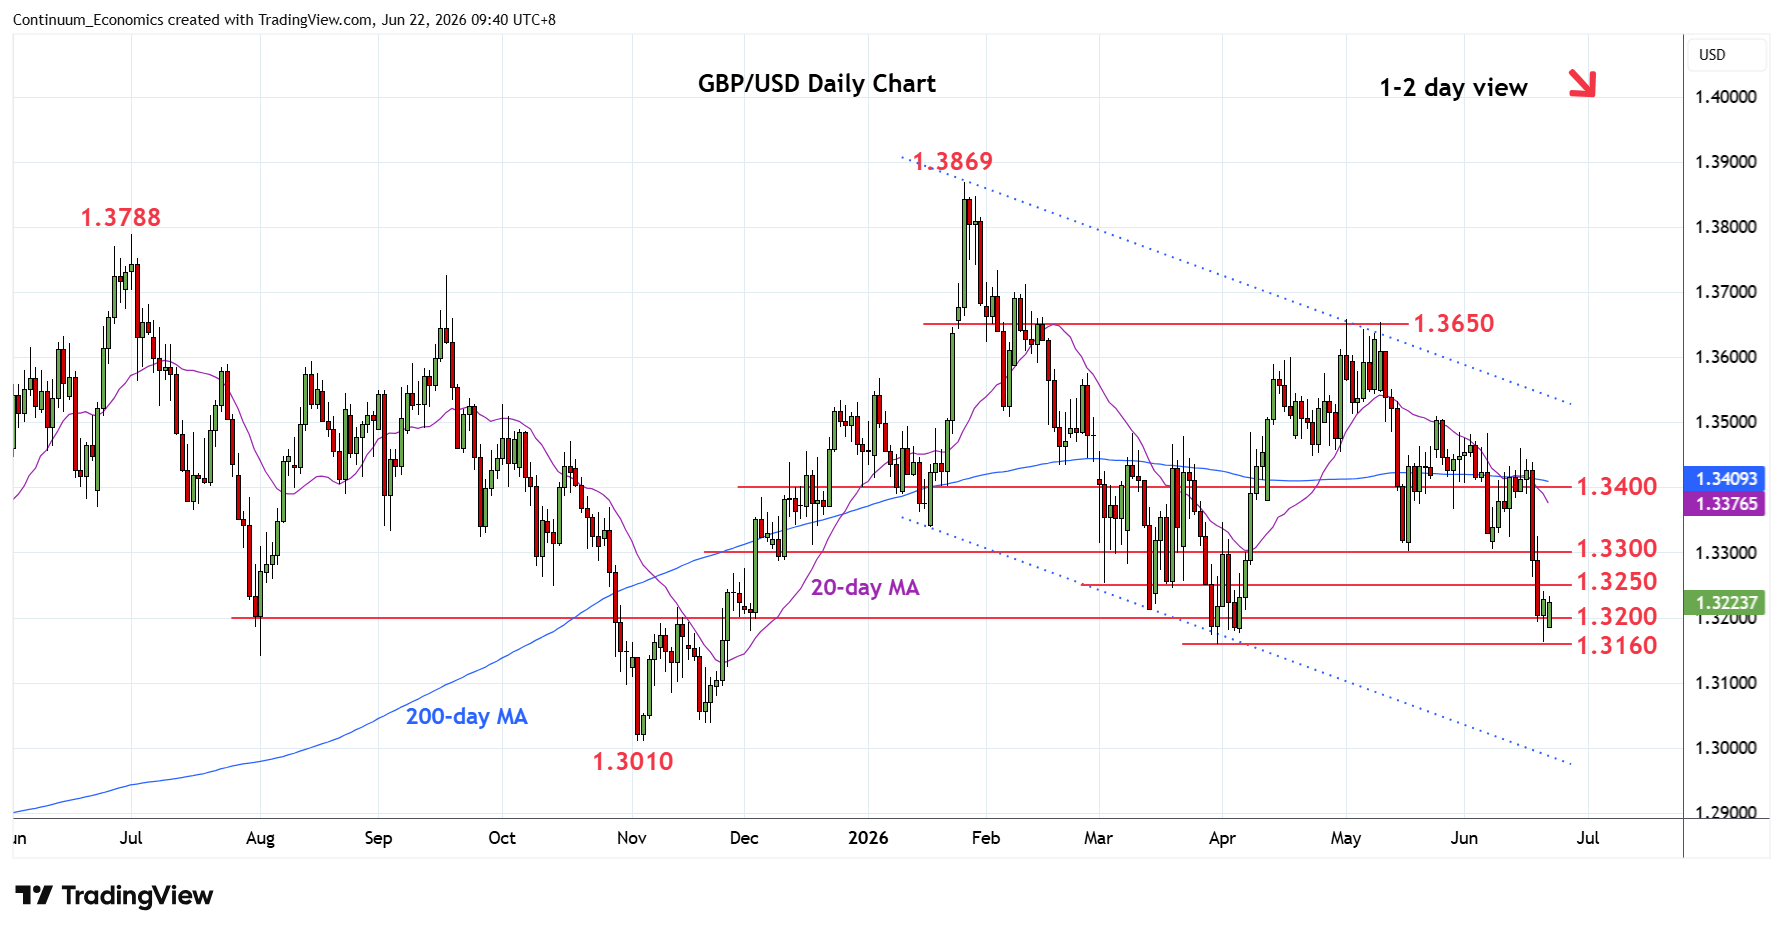
Turned up from retest of the 1.3160 March current year low as prices consolidate sharp losses last week
| Level | Comment | Level | Comment | |||||
|---|---|---|---|---|---|---|---|---|
| R4 | 1.3400 | * | congestion | S1 | 1.3160 | ** | 31 Mar YTD low | |
| R3 | 1.3350 | * | congestion | S2 | 1.3100 | * | congestion | |
| R2 | 1.3300 | ** | congestion, May low | S3 | 1.3038 | * | 20 Nov low | |
| R1 | 1.3250 | congestion | S4 | 1.3010 | ** | 4 Nov low |
Asterisk denotes strength of level
01:45 GMT - Turned up from retest of the 1.3160 March current year low as prices consolidate sharp losses last week from above the 1.3400 level. Daily studies are stretched as well and suggest scope for test higher towards resistance at 1.3250 and strong resistance at 1.3300 May low. The latter is expected to cap and sustain losses from the 1.3650 May swing high. Break here is needed to fade the downside pressure and see room for stronger recovery to 1.3350/1.3400 resistance. Break of the 1.3160 low will extend the January losses and see extension to 1.3100 initially.