Published: 2026-06-23T07:35:28.000Z
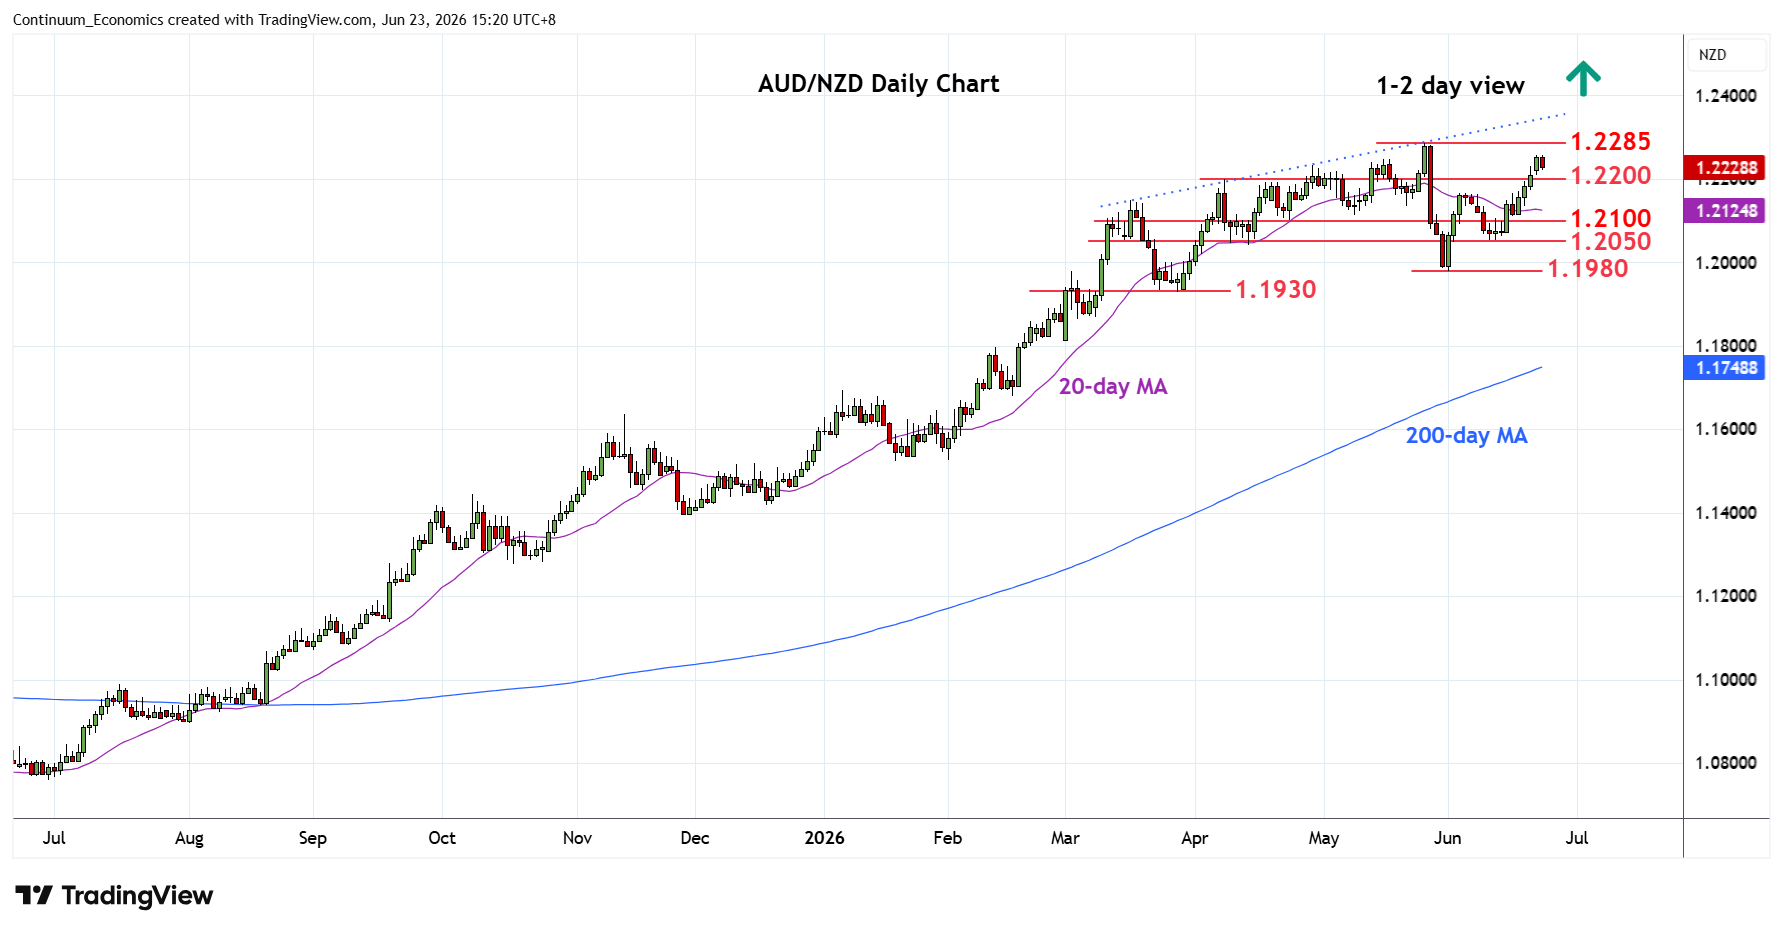
Chart AUD/NZD Update: Scope to retest 1.2285 May YTD high
-
Break above 1.2200 level see prices extending gains from the 1.1980 low to retrace almost all of the losses from the 1.2285 May high
| Level | Comment | Level | Comment | |||||
|---|---|---|---|---|---|---|---|---|
| R4 | 1.2370 | * | 2012 year low | S1 | 1.2200 | * | congestion | |
| R3 | 1.2345 | * | 61.8% 2011/2020 fall | S2 | 1.2165/50 | * | 3 Jun high, congestion | |
| R2 | 1.2300 | * | congestion | S3 | 1.2100 | * | congestion | |
| R1 | 1.2285 | ** | 26 May YTD high | S4 | 1.2050 | ** | 10 Jun low |
Asterisk denotes strength of level
07:30 GMT - Break above 1.2200 level see prices extending gains from the 1.1980 low to retrace almost all of the losses from the 1.2285 May current year high. Would expect reaction at the latter as daily studies extend into overbought areas. However, a later break cannot be ruled out to retrace the 2011/2020 fall to 1.2345, 61.8% Fibonacci retracement. Meanwhile, support is raised to the 1.2200 congestion and this extend to the 1.2165/50 area. Would take break here to fade the upside pressure and see return to support at 1.2100 congestion and 1.2050 low of 10 June.