Chart EUR/NOK Update: Consolidating NOK-driven gains - studies improving
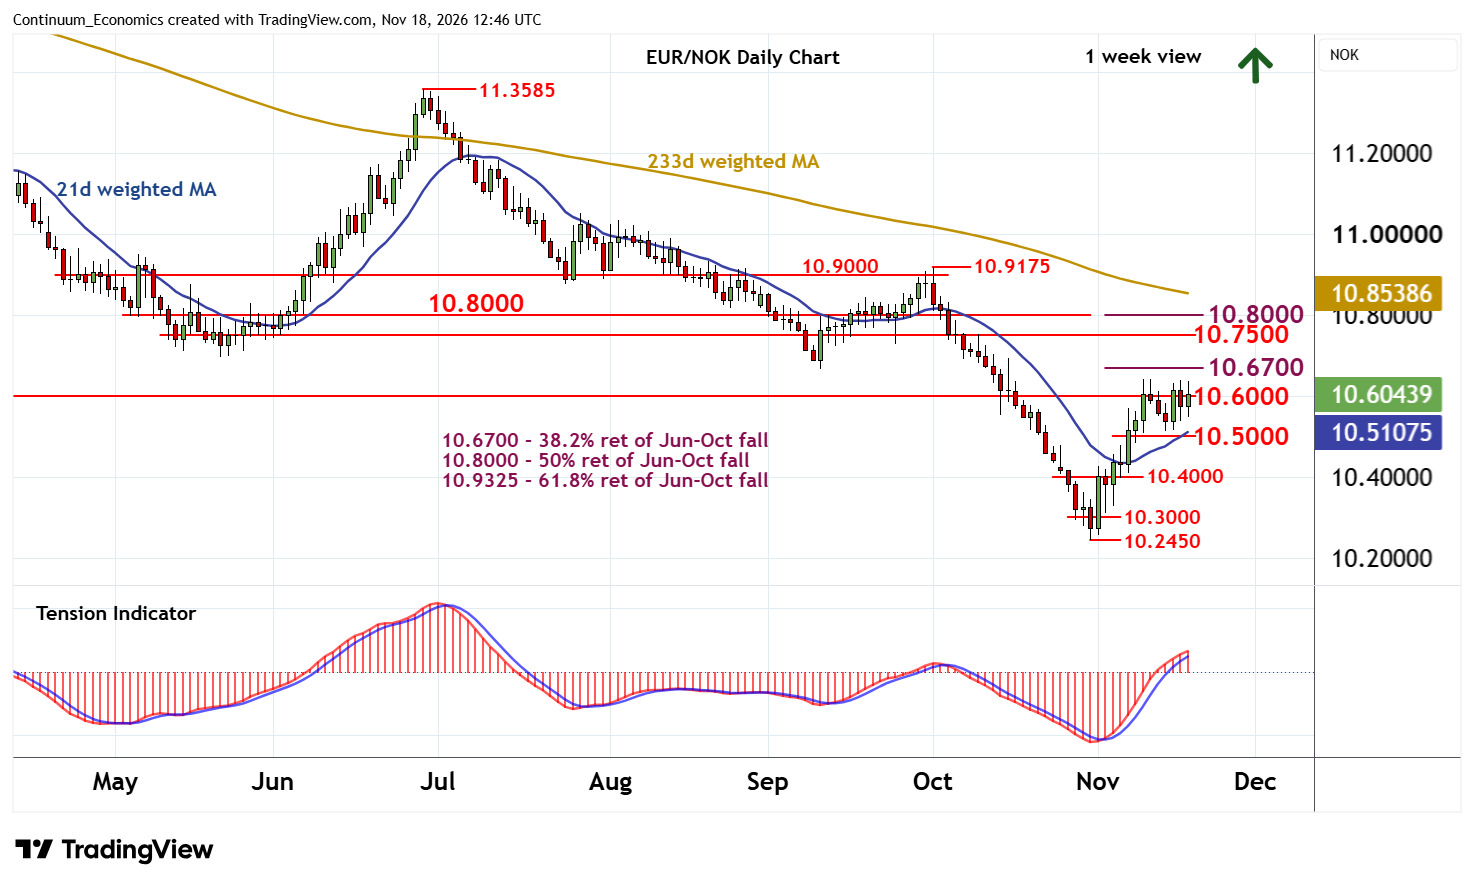
Little change, as NOK-driven gains from the 10.2450 current year low of 30 October give way to extended consolidation around support at 10.6000
| Levels | Imp | Comment | Levels | Imp | Comment | |||
|---|---|---|---|---|---|---|---|---|
| R4 | 10.9000 | ** | break level | S1 | 10.6000 | * | break level | |
| R3 | 10.8000 | ** | break level, 50% ret | S2 | 10.5000 | * | break level | |
| R2 | 10.7500 | * | break level | S3 | 10.4000 | * | congestion | |
| R1 | 10.6700 | ** | 38.2% ret of Jun-Oct fall | S4 | 10.2450 | ** | 30 Oct YTD low |
Asterisk denotes strength of level
12:25 GMT - Little change, as NOK-driven gains from the 10.2450 current year low of 30 October give way to extended consolidation around support at 10.6000. Daily readings have ticked higher and broader weekly charts continue to rise, highlighting room for further gains in the coming week(s). Resistance remains at the 10.6700 Fibonacci retracement. A later close above here will further improve sentiment and extend October gains towards strong resistance within the 10.7500 - 10.8000 range.
Meanwhile, support extends down to 10.5000 and should continue to underpin any immediate setbacks. An unexpected close beneath here would weigh on sentiment, as focus then turns to congestion around 10.4000.