Published: 2026-09-25T01:00:24.000Z
Chart USD/JPY Update: Extending September gains, but stretched
4
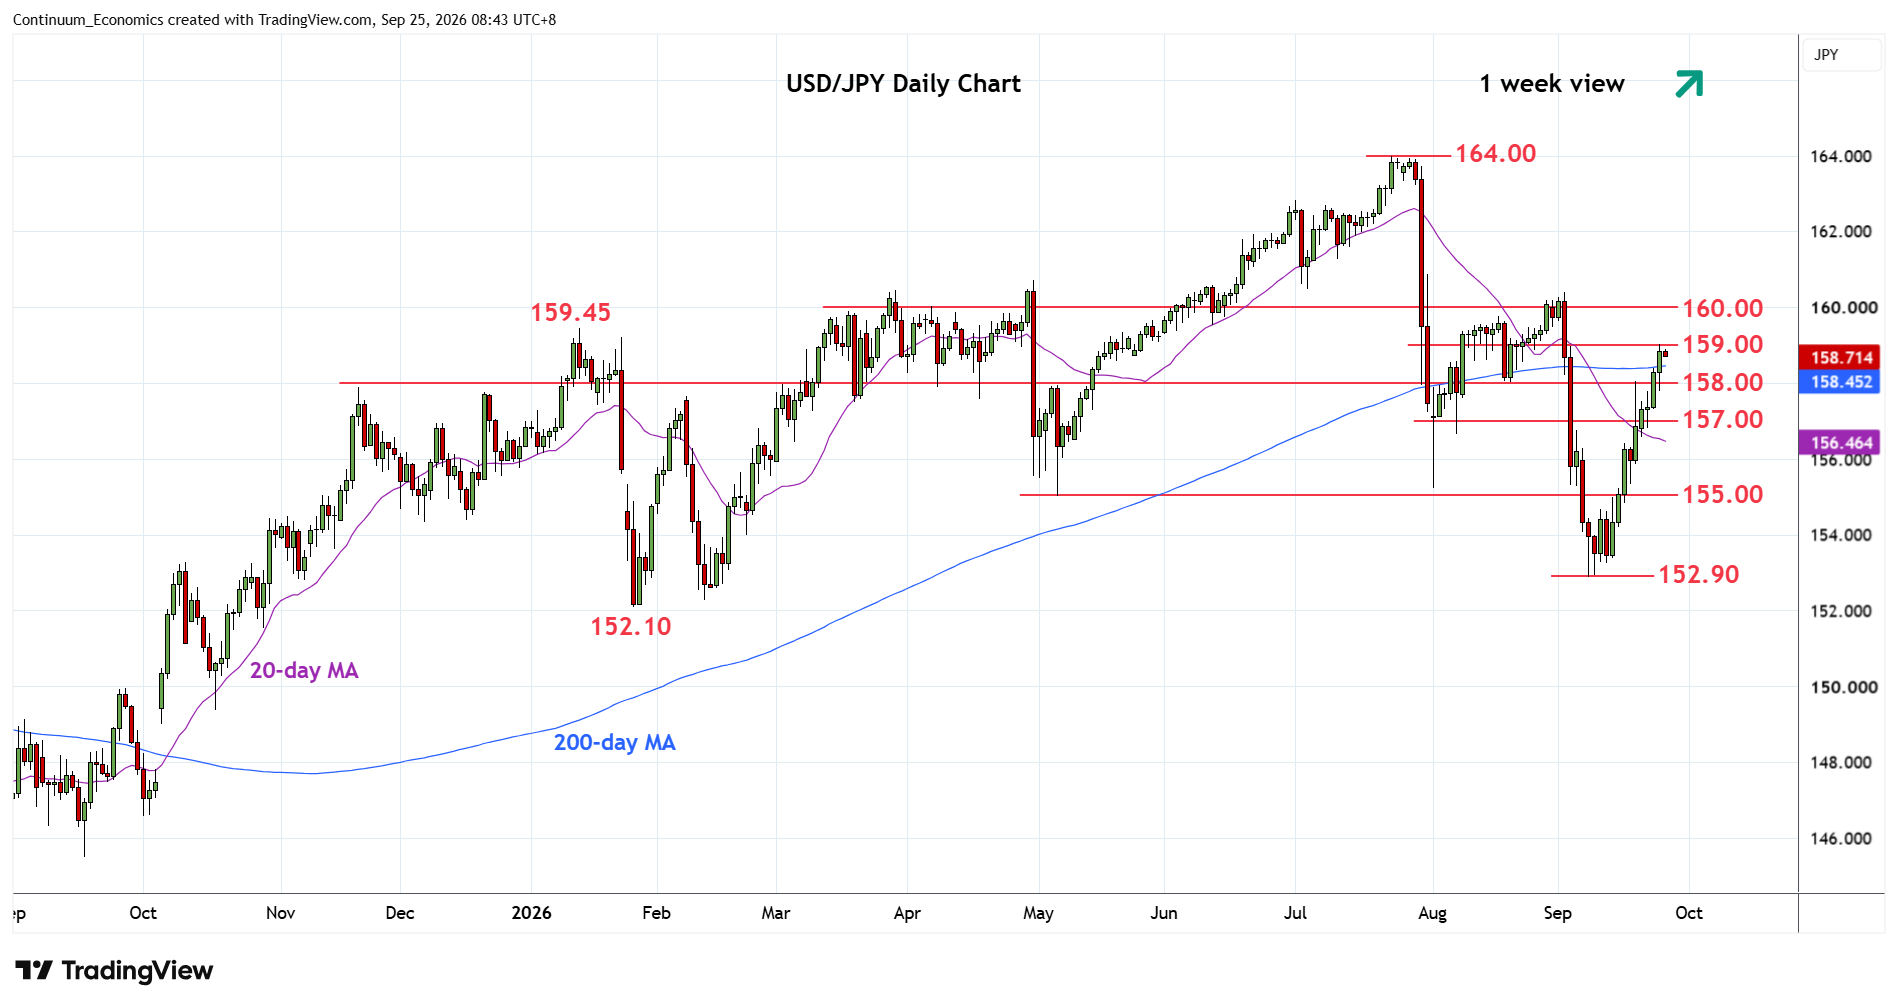
Break of the 158.40, 200-day MA and Fibonacci level, has seen extension to resistance at 159.00
| Levels | Imp | Comment | Levels | Imp | Comment | |||
|---|---|---|---|---|---|---|---|---|
| R4 | 160.00 | ** | figure, congestion | S1 | 158.00 | * | congestion | |
| R3 | 159.75 | * | 61.8% Jul/Sep fall | S2 | 157.00 | * | congestion | |
| R2 | 159.45 | * | Jan high | S3 | 156.50/00 | * | congestion | |
| R1 | 159.00 | * | congestion | S4 | 155.00 | ** | May low, congestion |
Asterisk denotes strength of level
00:50 GMT - Break of the 158.40, 200-day MA and Fibonacci level, has seen extension to resistance at 159.00. Consolidation here see prices unwinding the stretched intraday and daily studies but further gains cannot be ruled out to extend strong gains from the 152.90 low. Higher will see room for extension to the 159.45/75 January high and 61.8% Fibonacci level. Clearance here will turn focus to 160.00 figure. Meanwhile, support is raised to 158.00 congestion. Would take break here to ease the upside pressure and see room turning lower in consolidation towards 157.00 congestion and the 156.50/156.00 area.