Published: 2026-08-04T06:41:20.000Z
Chart AUD/NZD Update: Turned up from 1.1930/00 support
3
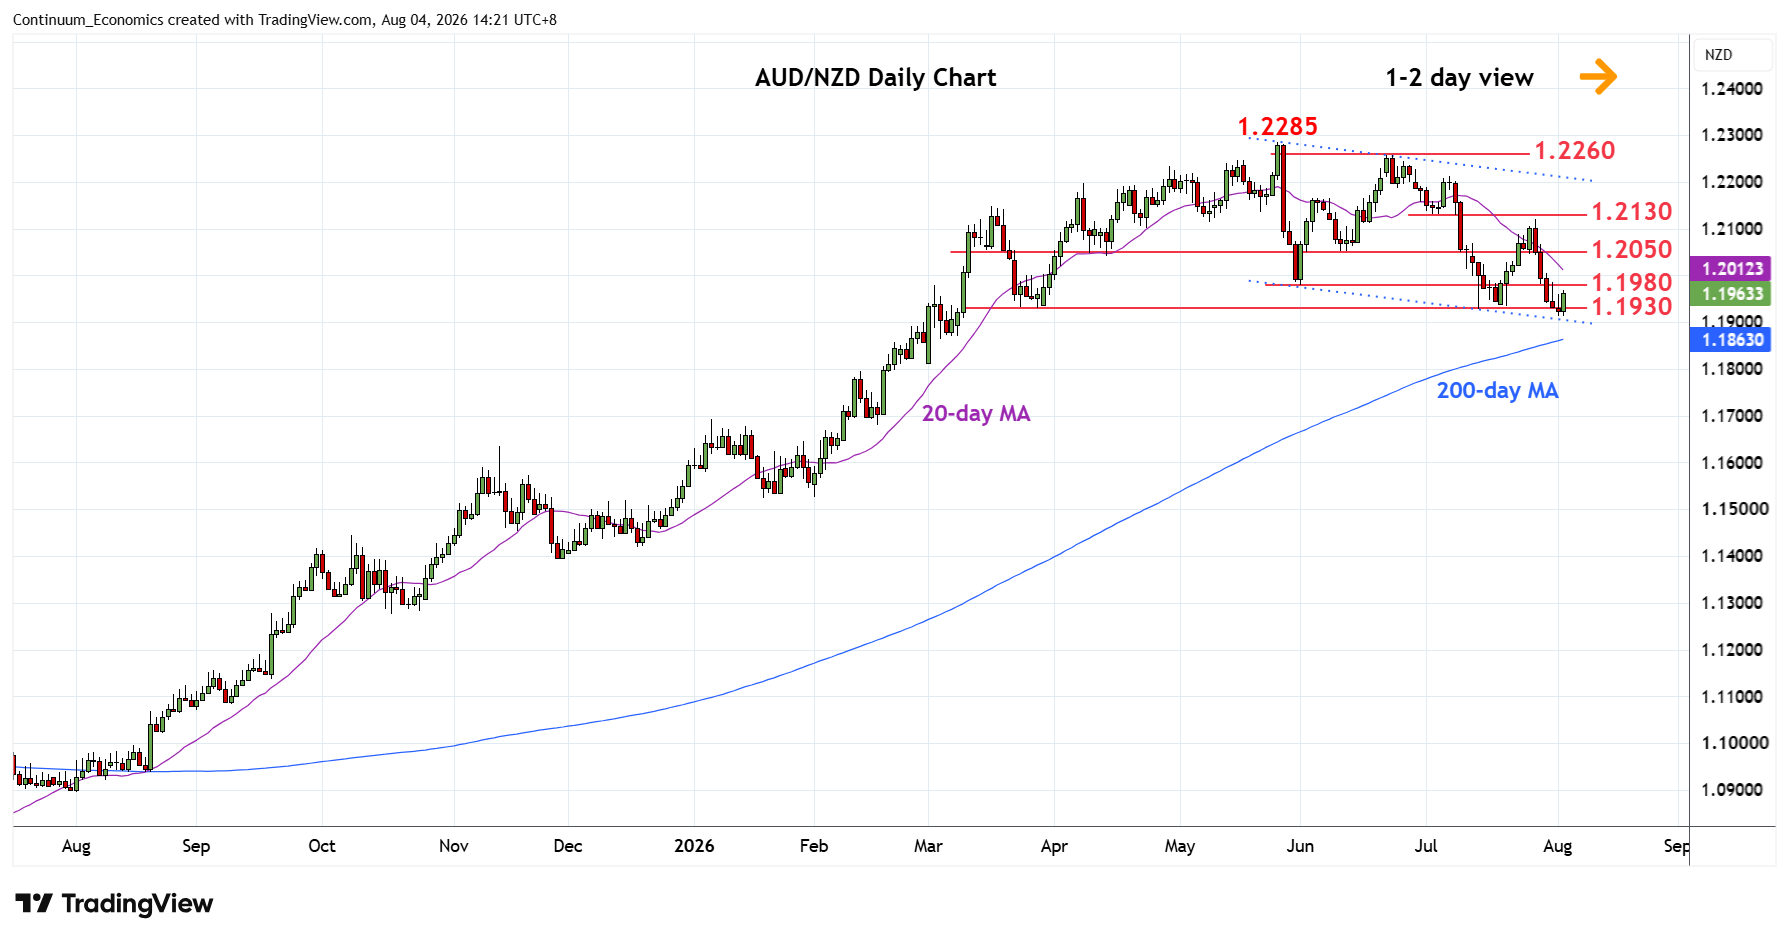
Limited on break of the 1.1930 support as prices turned up from channel support from the 1.2285 May current year high
| Level | Comment | Level | Comment | |||||
|---|---|---|---|---|---|---|---|---|
| R4 | 1.2130 | ** | 3 Jul low | S1 | 1.1930 | ** | 14 Jul low | |
| R3 | 1.2100 | * | congestion | S2 | 1.1900 | * | figure, congestion | |
| R2 | 1.2050 | * | congestion | S3 | 1.1850 | * | congestion | |
| R1 | 1.1980/00 | * | Jun low, congestion | S4 | 1.1800 | * | congestion |
Asterisk denotes strength of level
06:35 GMT - Limited on break of the 1.1930 support as prices turned up from channel support from the 1.2285 May current year high. Bounce see prices unwinding oversold intraday and daily studies with resistance starting at 1.1980/1.2000 June low and congestion area. Above here, will see room for stronger bounce the 1.2050/1.2100 congestion area. Negative weekly studies suggest this giving way to renewed selling pressure later to retest the 1.1930/00 low and congestion. Below the latter will see deeper pullback to retrace the 2025/2026 rally and see room to 1.1850/1.1800 congestion.