Chart GBP/USD Update: Pressuring resistance - background studies continue to rise
Little change, as the anticipated test of resistance at the 1.3470 Fibonacci retracement and congestion around 1.3500 gives way to consolidation
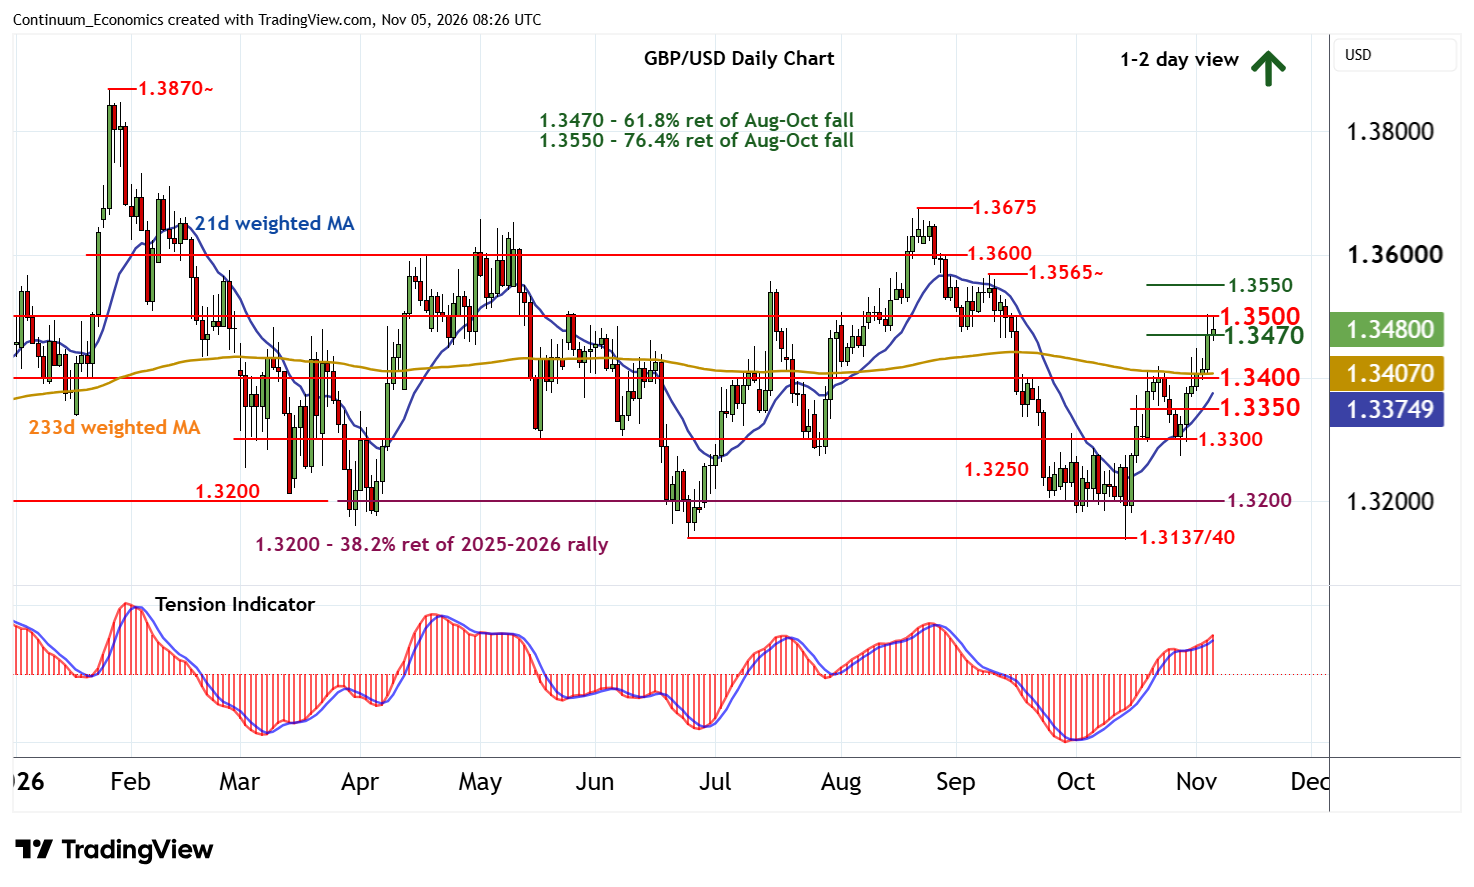
| Level | Comment | Level | Comment | |||||
|---|---|---|---|---|---|---|---|---|
| R4 | 1.3565~ | 9 Sep (m) high | S1 | 1.3400 | ** | congestion | ||
| R3 | 1.3550 | ** | 76.4% ret of Aug-Oct fall | S2 | 1.3350 | break level | ||
| R2 | 1.3500 | ** | congestion | S3 | 1.3300 | ** | congestion | |
| R1 | 1.3470 | ** | 61.8% ret of Aug-Oct fall | S4 | 1.3250 | * | congestion |
Asterisk denotes strength of level
08:10 GMT - Little change, as the anticipated test of resistance at the 1.3470 Fibonacci retracement and congestion around 1.3500 gives way to consolidation within here, as overbought daily stochastics flatten. The daily Tension Indicator continues to rise and broader weekly charts are positive, pointing to room for further gains in the coming sessions. A close above here will further improve sentiment and extend mid-October gains towards congestion around 1.3500. Still higher is the 1.3550 retracement, where already overbought daily stochastics could prompt profit-taking/consolidation.
Meanwhile, support remains at congestion around 1.3400. A close beneath here, if seen, would help to stabilise sentiment and prompt consolidation above 1.3350.