Published: 2026-09-16T00:38:03.000Z
Chart NZD/USD Update: Extending losses
1
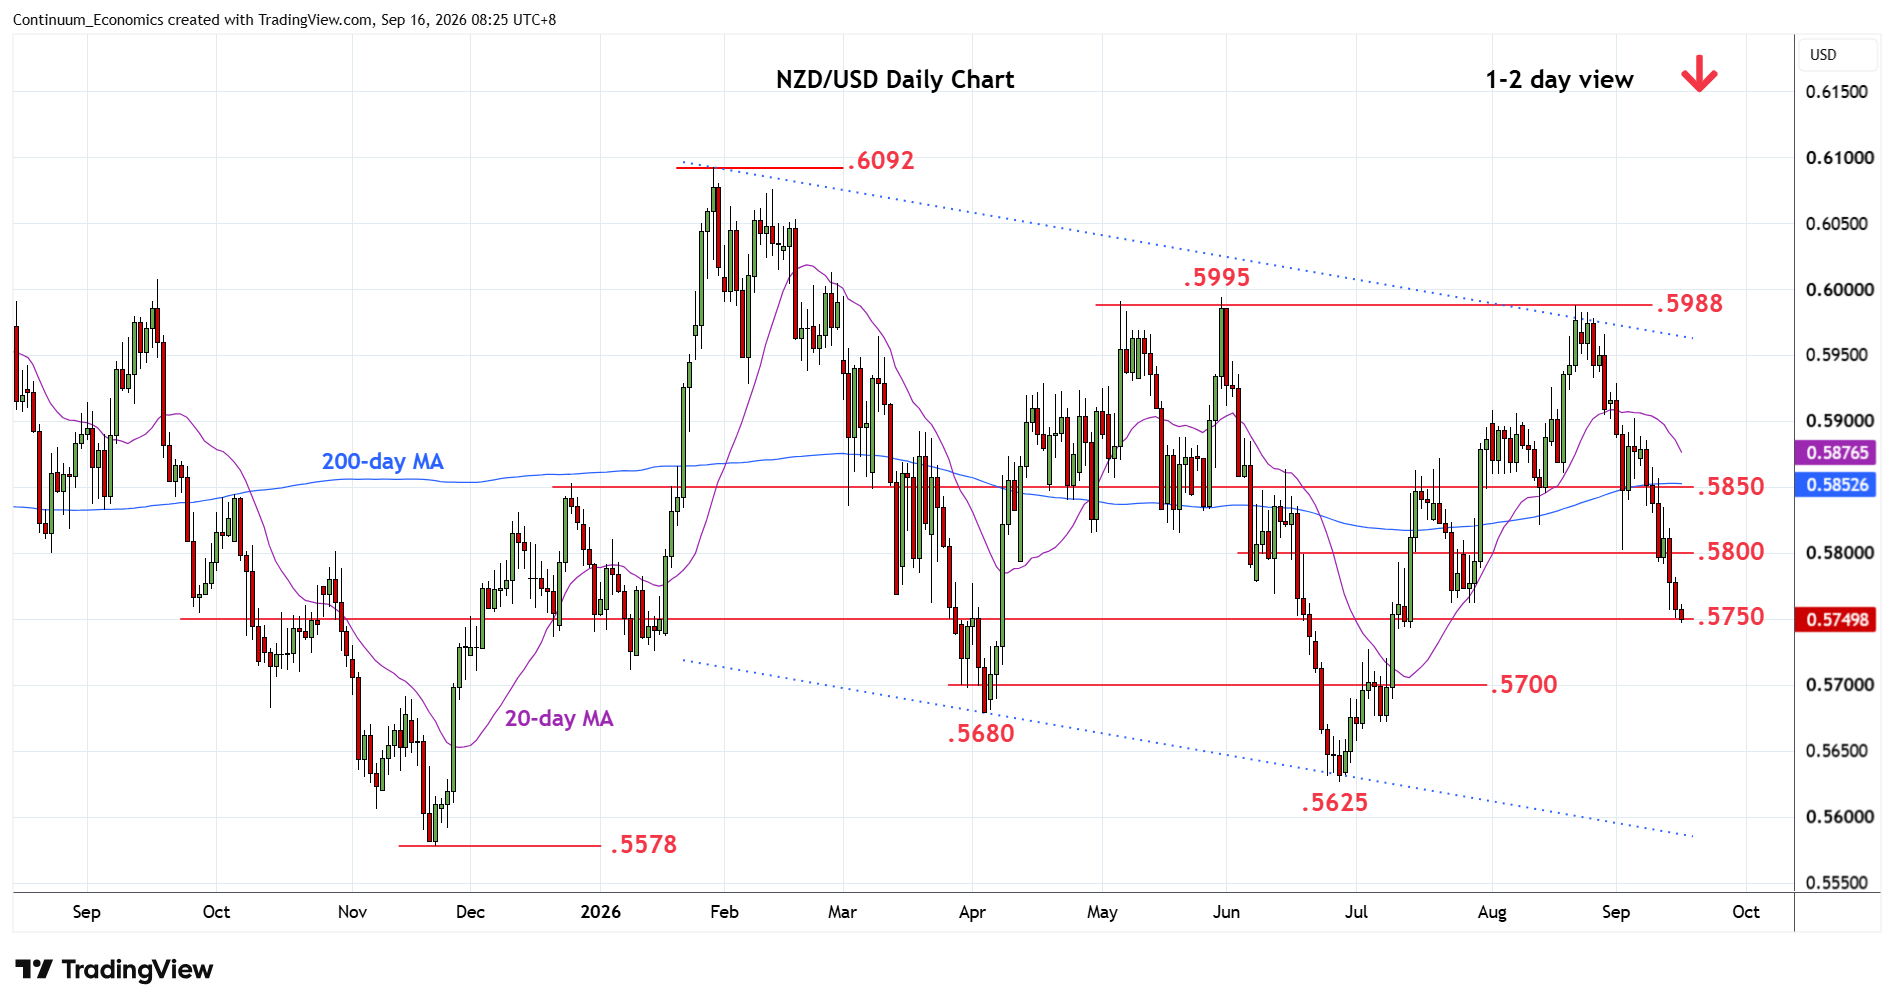
Prices remain under pressure with losses extending to the .5762/50 Fibonacci level and congestion area
| Levels | Imp | Comment | Levels | Imp | Comment | |||
|---|---|---|---|---|---|---|---|---|
| R4 | .5930 | 1 Sep high | S1 | .5750 | * | congestion | ||
| R3 | .5900 | ** | congestion | S2 | .5720/00 | * | congestion | |
| R2 | .5850 | * | congestion | S3 | .5680 | ** | Apr low | |
| R1 | .5800 | * | congestion | S4 | .5650 | * | congestion |
Asterisk denotes strength of level
00:30 GMT - Prices remain under pressure with losses extending to the .5762/50 Fibonacci level and congestion area. Negative daily and weekly studies suggest scope for break here to further extend losses from the August high. Lower will open up room to the .5720/00 congestion area and the .5680 April low. Below these will Meanwhile, resistance remains at the .5800 congestion. Would need to regain this to ease the bearish pressure and open up room for consolidation towards strong resistance at the .5850/.5900 area.