Published: 2026-06-23T00:40:04.000Z
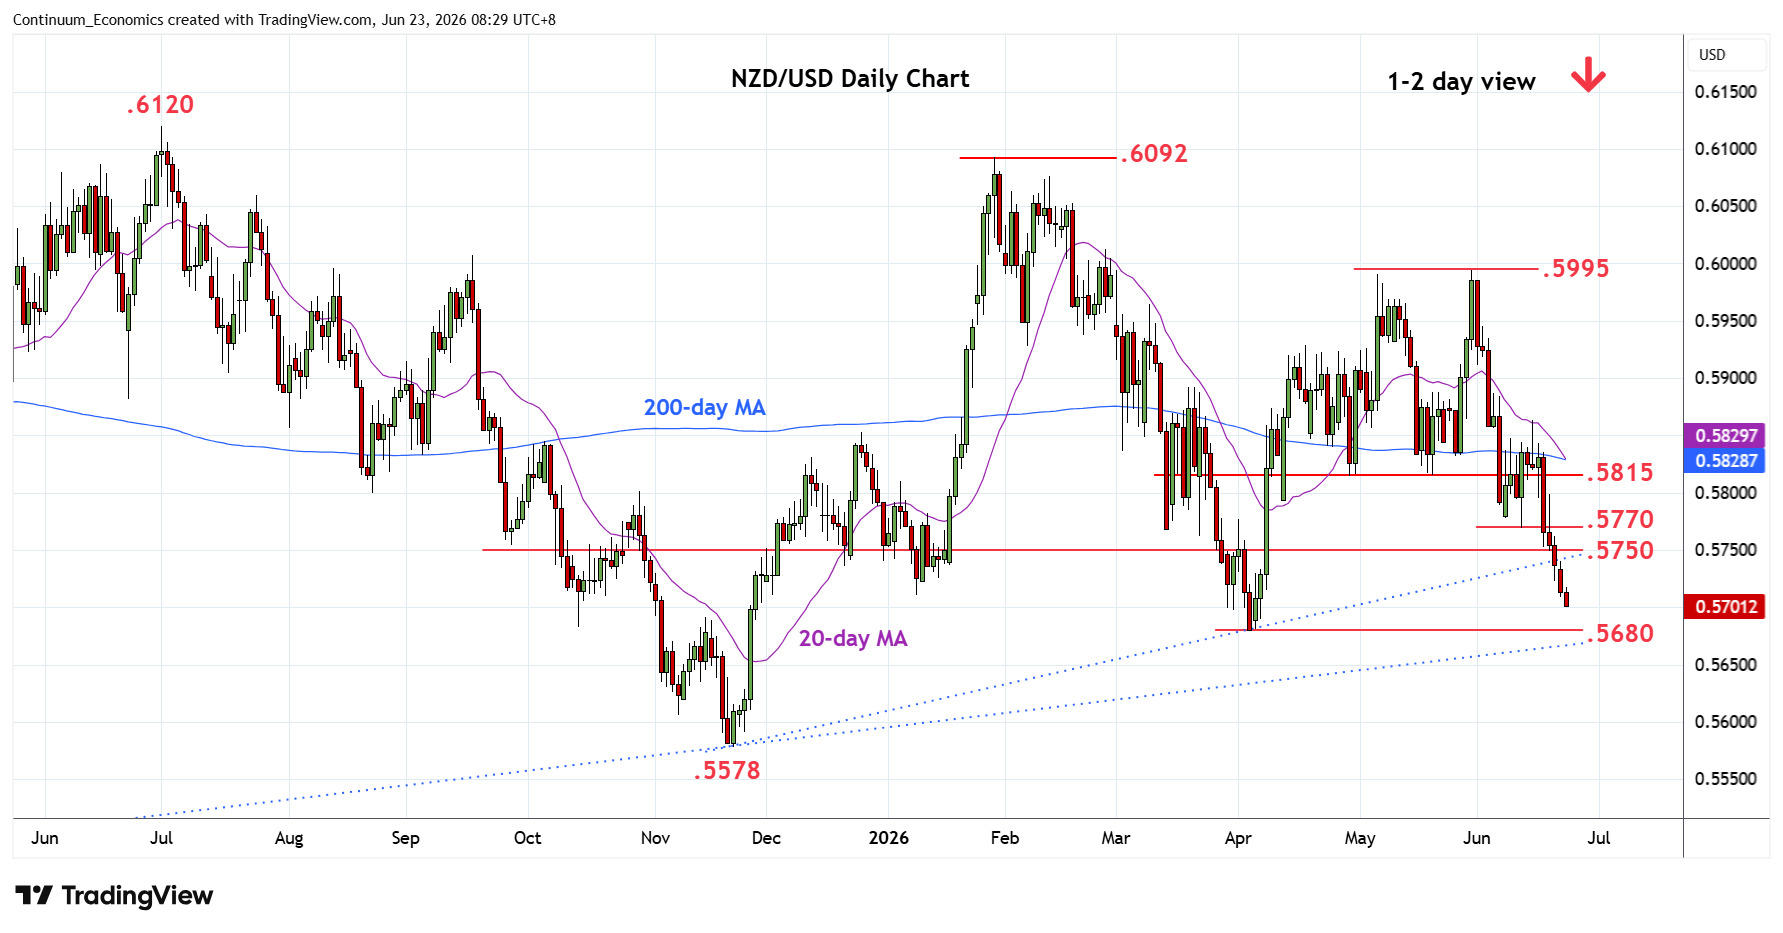
Chart NZD/USD Update: Weighing on .5700/.5680 support
-
Under pressure, as prices extend losses from the high of last week to reach the .5700 level
| Levels | Imp | Comment | Levels | Imp | Comment | |||
|---|---|---|---|---|---|---|---|---|
| R4 | .5865 | * | 15 Jun high | S1 | .5700 | * | Mar low, congestion | |
| R3 | .5800/15 | ** | congestion, May low | S2 | .5680 | ** | 3 Apr YTD low | |
| R2 | .5770 | * | 11 Jun low | S3 | .5650 | * | congestion | |
| R1 | .5750 | congestion | S4 | .5605 | 7 Nov low |
Asterisk denotes strength of level
00:30 GMT - Under pressure, as prices extend losses from the high of last week to reach the .5700 level. Below this will expose the .5680 April current year low to retest. Stretched daily studies suggest reaction here likely but a later brek cannot be ruled out to extend the broader losses from the .6092 January high. Meanwhile, resistance is lowered to the .5750/70 congesion and low of 11 June which is expected to cap corrective bounce. Regaining this will ease the downside pressure and open up room for strong bounce to the .5800/15 resistance.