Weekly Chart USD Index DXY: Consolidating - studies under pressure
The anticipated continuation of losses from the 101.80 current year high of 24 June has been delayed, as prices extend consolidation beneath congestion resistance at 100.00
The anticipated continuation of losses from the 101.80 current year high of 24 June has been delayed, as prices extend consolidation beneath congestion resistance at 100.00.
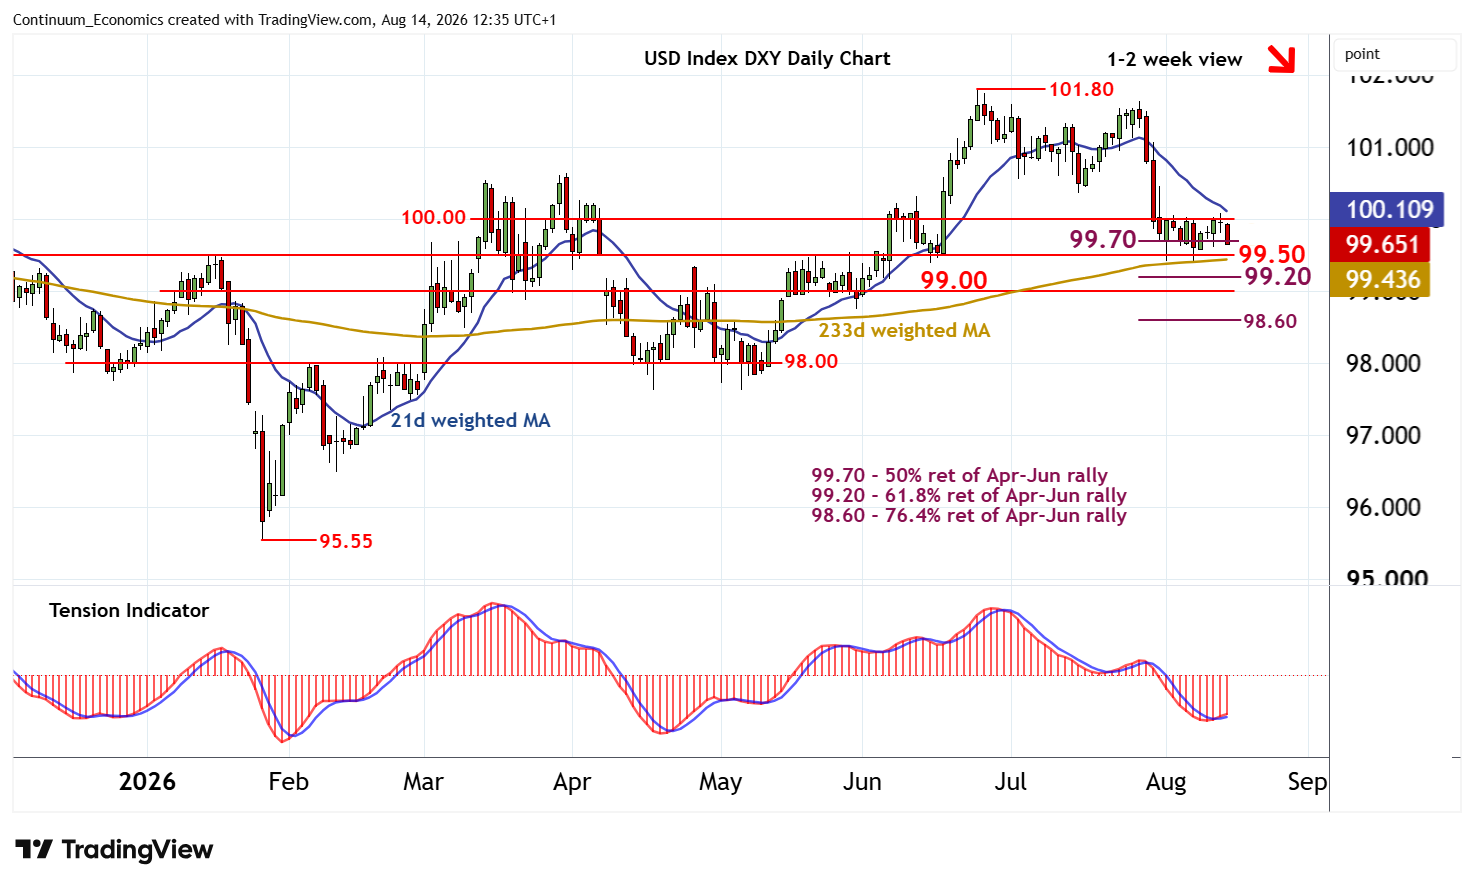
Daily readings are mixed, suggesting room for further consolidation, before bearish weekly charts prompt further losses.
Support remains at the 99.70 Fibonacci retracement and extends to congestion around 99.50.
A later close beneath here will add weight to sentiment and extend June losses below further congestion around 99.00 towards the 98.60 Fibonacci retracement.
Meanwhile, resistance remains at 100.00.
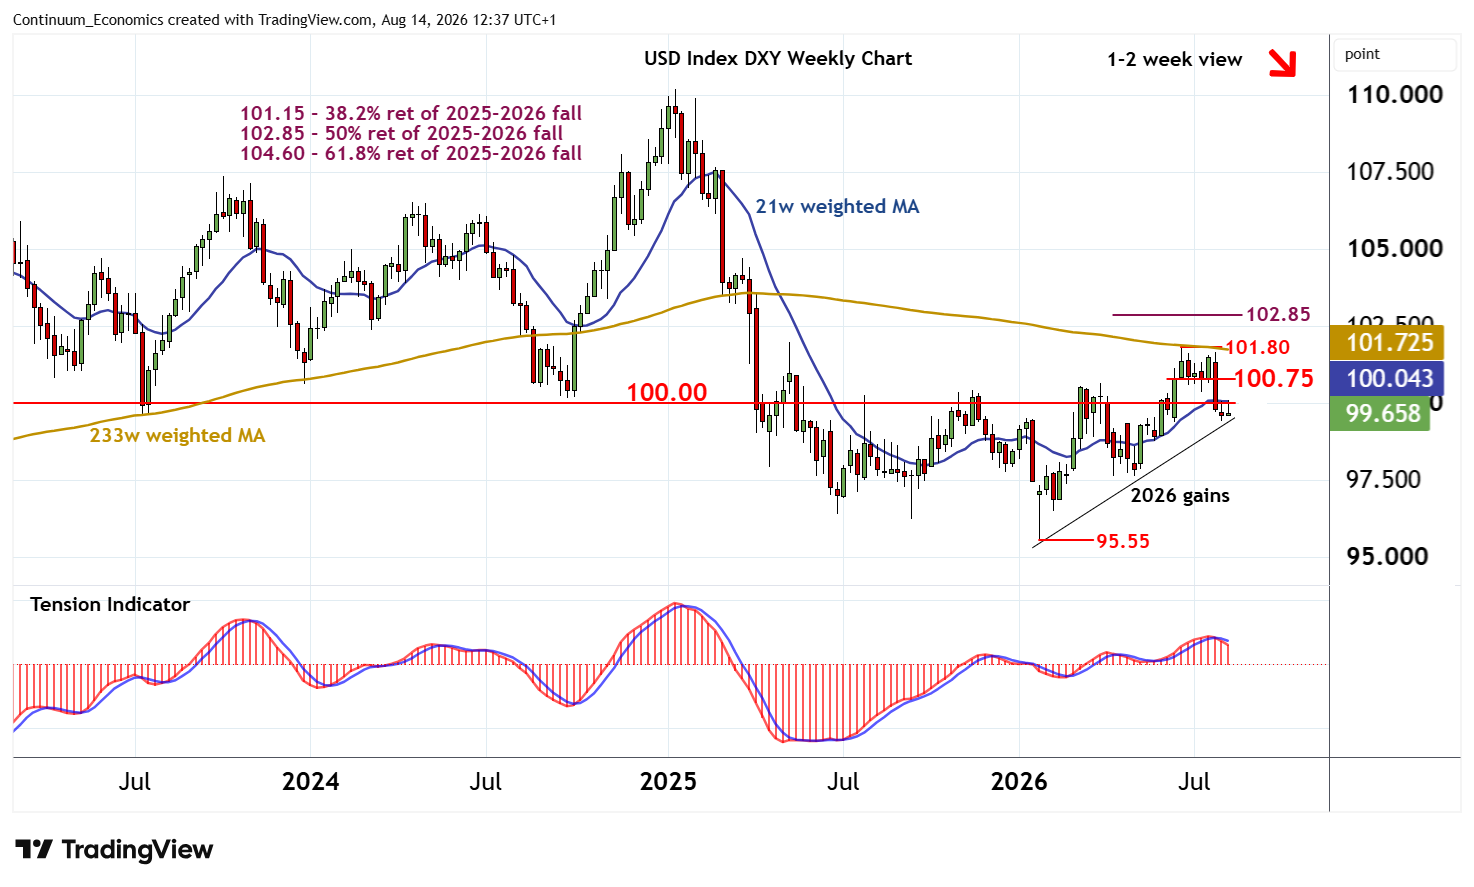
A close above here, if seen, would help to stabilise price action. But negative weekly charts should prompt renewed selling interest into any continuation towards the 100.75 base of the multi-week distribution top beneath 101.80.
A further close above here is needed, not seen, to turn sentiment positive once again and extend 2026 gains towards the 102.85 Fibonacci retracement.