Weekly Chart USD Index DXY: Gains to remain limited - background studies under pressure
The test of support at the 98.60 Fibonacci retracement is giving way to a steady drift higher, as daily stochastics and the daily Tension Indicator turn bullish
The test of support at the 98.60 Fibonacci retracement is giving way to a steady drift higher, as daily stochastics and the daily Tension Indicator turn bullish.
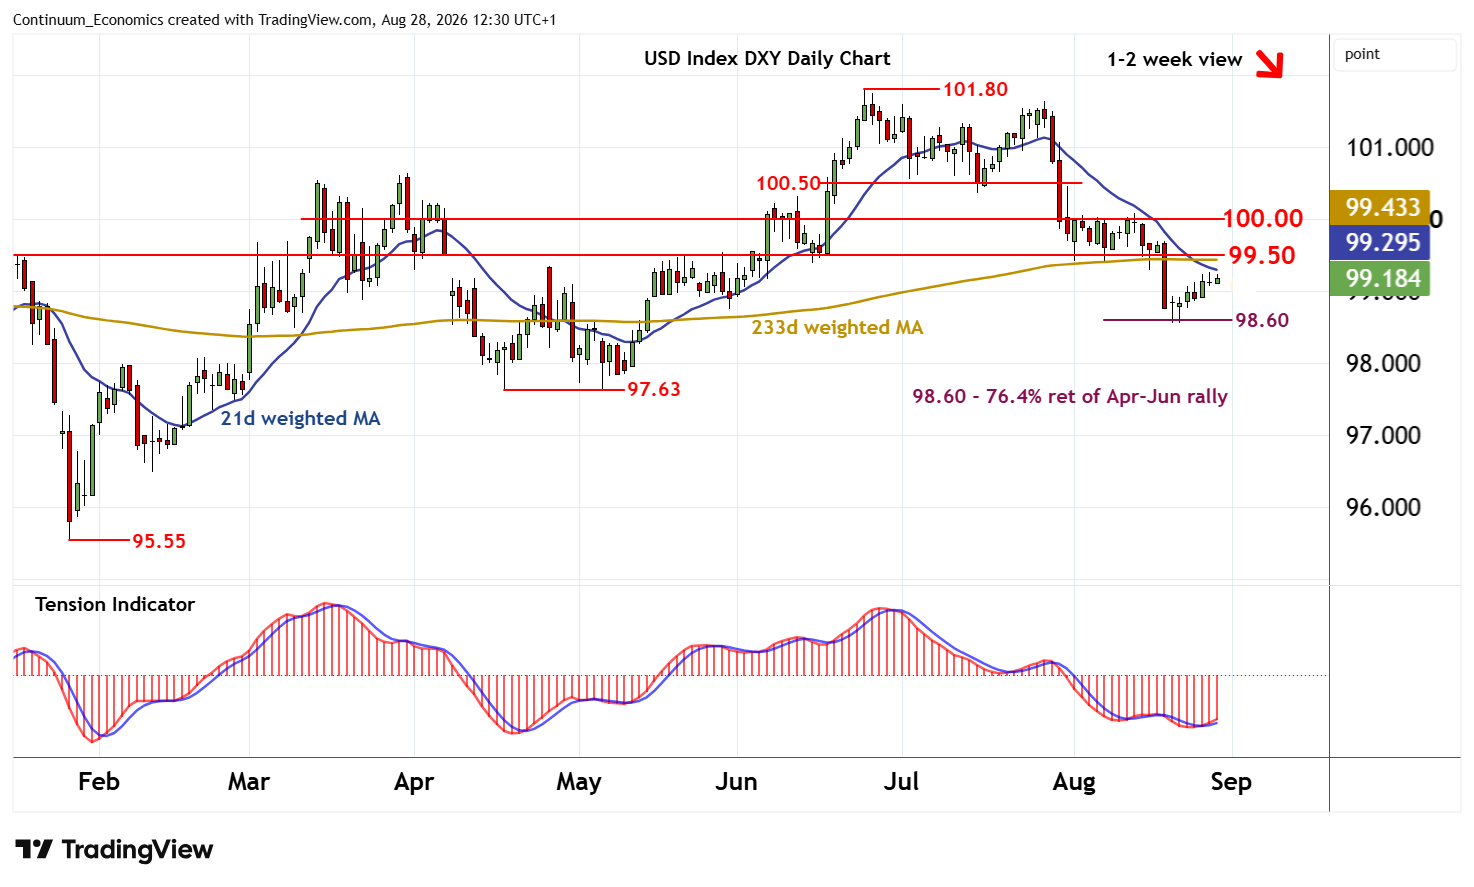
Continuation towards resistance at the 99.50 congestion lows cannot be ruled out. But any break should give way to fresh range extension within congestion beneath 100.00, as daily stochastics become overbought and broader weekly charts remain under pressure.
A close above here, however, will improve sentiment and prompt a more significant bounce, as late-August gains then focus on the 100.50 break level.
Following corrective gains, fresh losses are looked for.
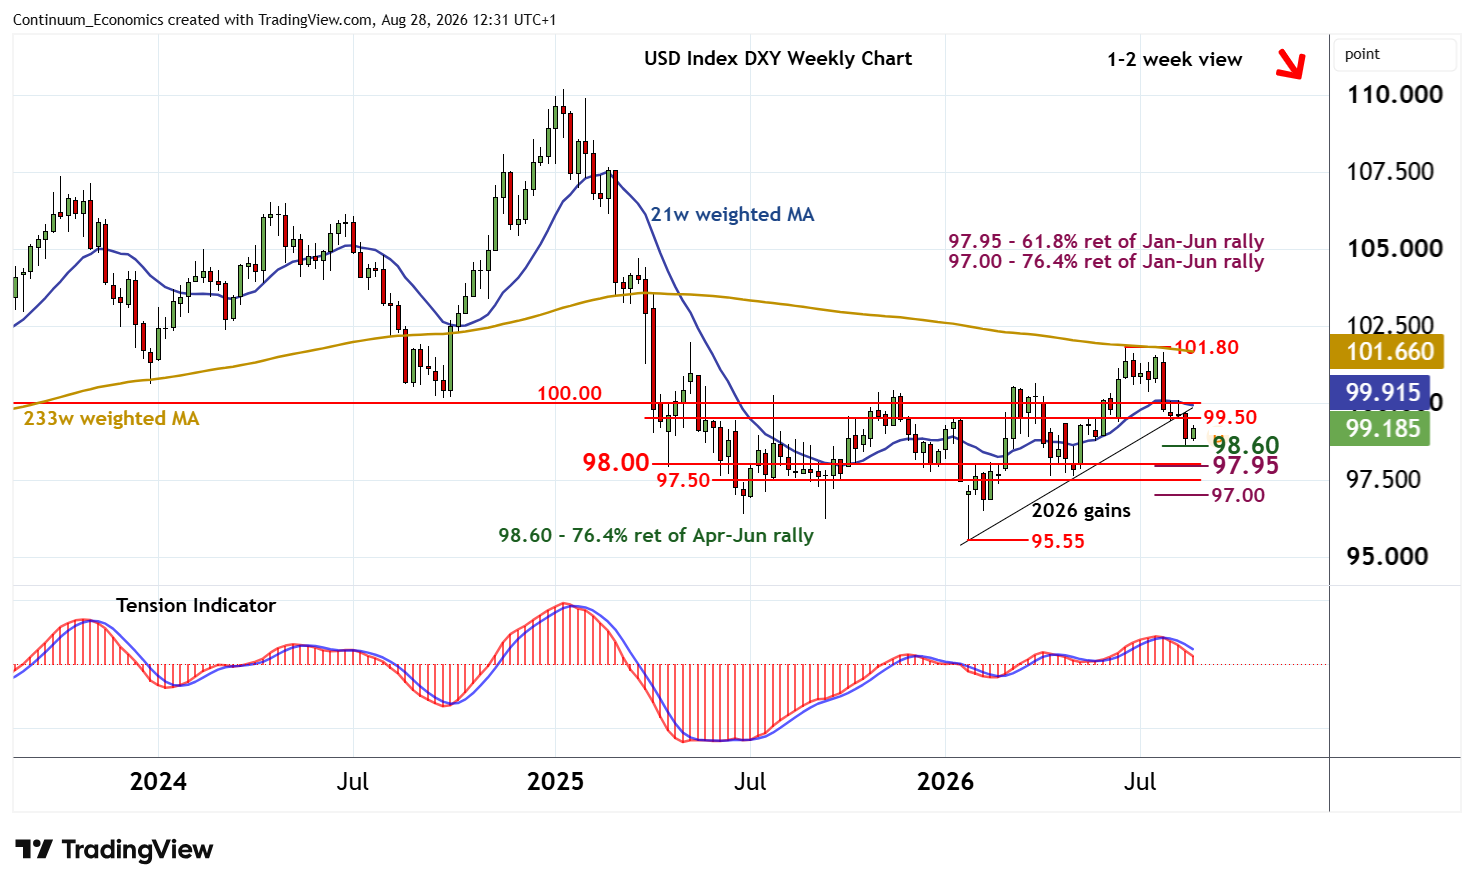
A later close below 98.60 will add weight to sentiment and extend losses from the 101.80 current year high of 24 June towards strong support at the 97.95 longer-term Fibonacci retracement and congestion around 98.00. Just beneath here is further congestion around 97.50. But already oversold weekly stochastics could limit any initial tests in short-covering/consolidation, before further losses unfold.