Published: 2026-06-25T01:41:05.000Z
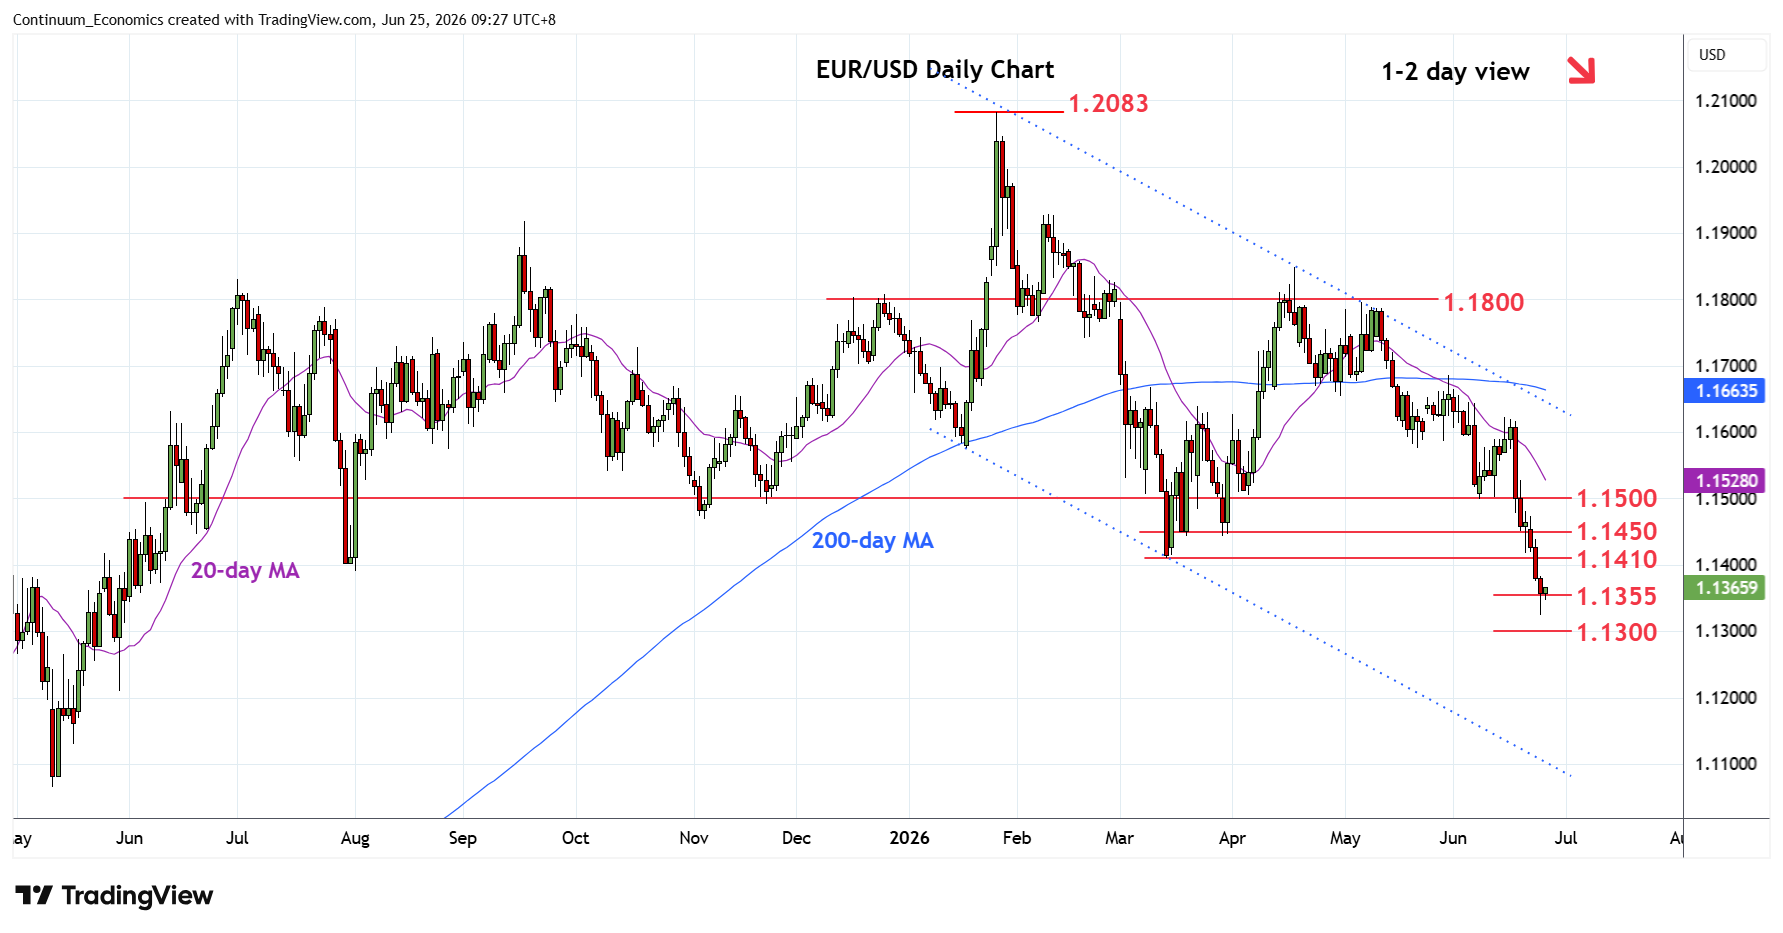
Chart EUR/USD Update: Consolidating at 1.1325 fresh year low
1
Losses through the 1.1355 Fibonacci level has seen extension to fresh year low at 1.1325
| Levels | Imp | Comment | Levels | Imp | Comment | |||
|---|---|---|---|---|---|---|---|---|
| R4 | 1.1550/75 | ** | congestion, May low | S1 | 1.1355 | * | 38.2% 2025/2026 rally | |
| R3 | 1.1500 | ** | 8 Jun low | S2 | 1.1325 | ** | 24 Jun YTD low | |
| R2 | 1.1450 | * | congestion | S3 | 1.1275 | * | 2023 year high | |
| R1 | 1.1400/10 | ** | congestion, Mar low | S4 | 1.1210/00 | ** | congestion, 2024 yr high |
Asterisk denotes strength of level
01:30 GMT - Losses through the 1.1355 Fibonacci level has seen extension to fresh year low at 1.1325 before turning up to consolidate sharp losses from above 1.1600 high of last week. Intraday studies are unwinding oversold readings with daily studies stretched as well, suggesting scope for corrective bounce before giving way fresh selling pressure. Meanwhile, resistance is at the 1.1400/10 congestion and March low which is expected to cap. Gains above here will ease the downside pressure and see room for stronger bounce to the 1.1450/1.1500 area.