Published: 2026-05-27T07:14:05.000Z
Chart USD Index DXY Update: Cautious trade - daily studies under pressure
2
Little change, as prices extend cautious trade above congestion support at 99.00
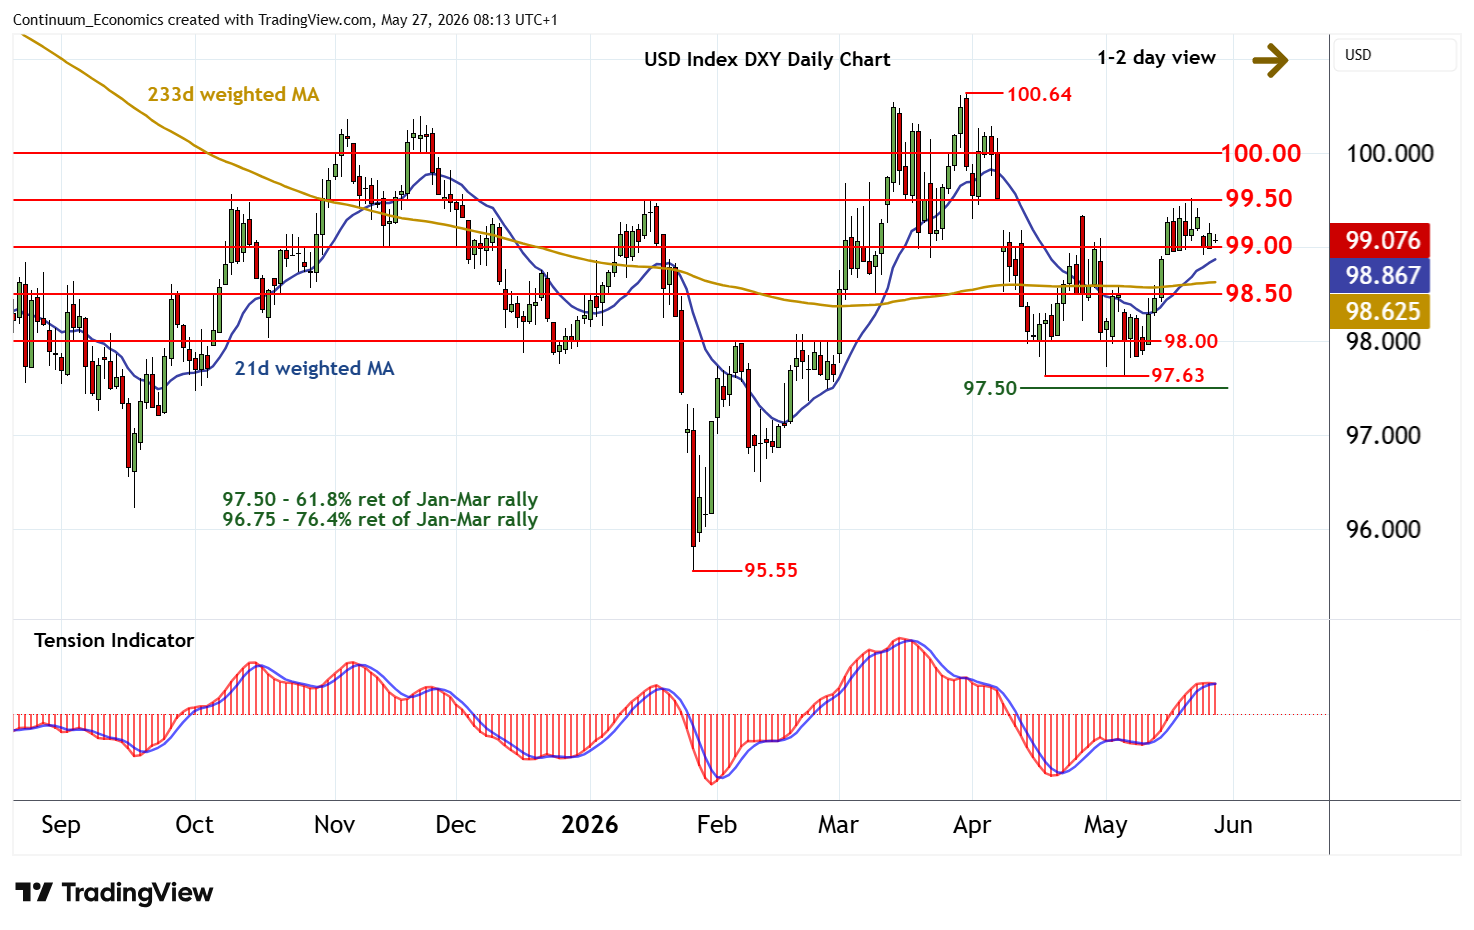
| Levels | Imp | Comment | Levels | Imp | Comment | |||
|---|---|---|---|---|---|---|---|---|
| R4 | 100.64 | ** | 31 Mar YTD high | S1 | 99.00 | * | congestion | |
| R3 | 100.29 | * | 6 Apr (m) high | S2 | 98.50 | * | congestion | |
| R2 | 100.00 | ** | congestion | S3 | 98.00 | * | congestion | |
| R1 | 99.50 | * | congestion, gap high | S4 | 97.63 | ** | 17 Apr (m) low |
Asterisk denotes strength of level
08:05 BST - Little change, as prices extend cautious trade above congestion support at 99.00. Overbought daily stochastics are unwinding and the flat daily Tension Indicator is coming under pressure, highlighting room for a later break beneath here. Focus will then turn to further congestion around 98.50. But mixed/positive weekly charts should limit any initial tests in fresh buying interest/consolidation. Meanwhile, resistance remains at 99.50. A close above here would improve sentiment and extend mid-April gains towards 100.00, where overbought daily stochastics could prompt fresh consolidation.