Chart GBP/USD Update: Limited tests higher
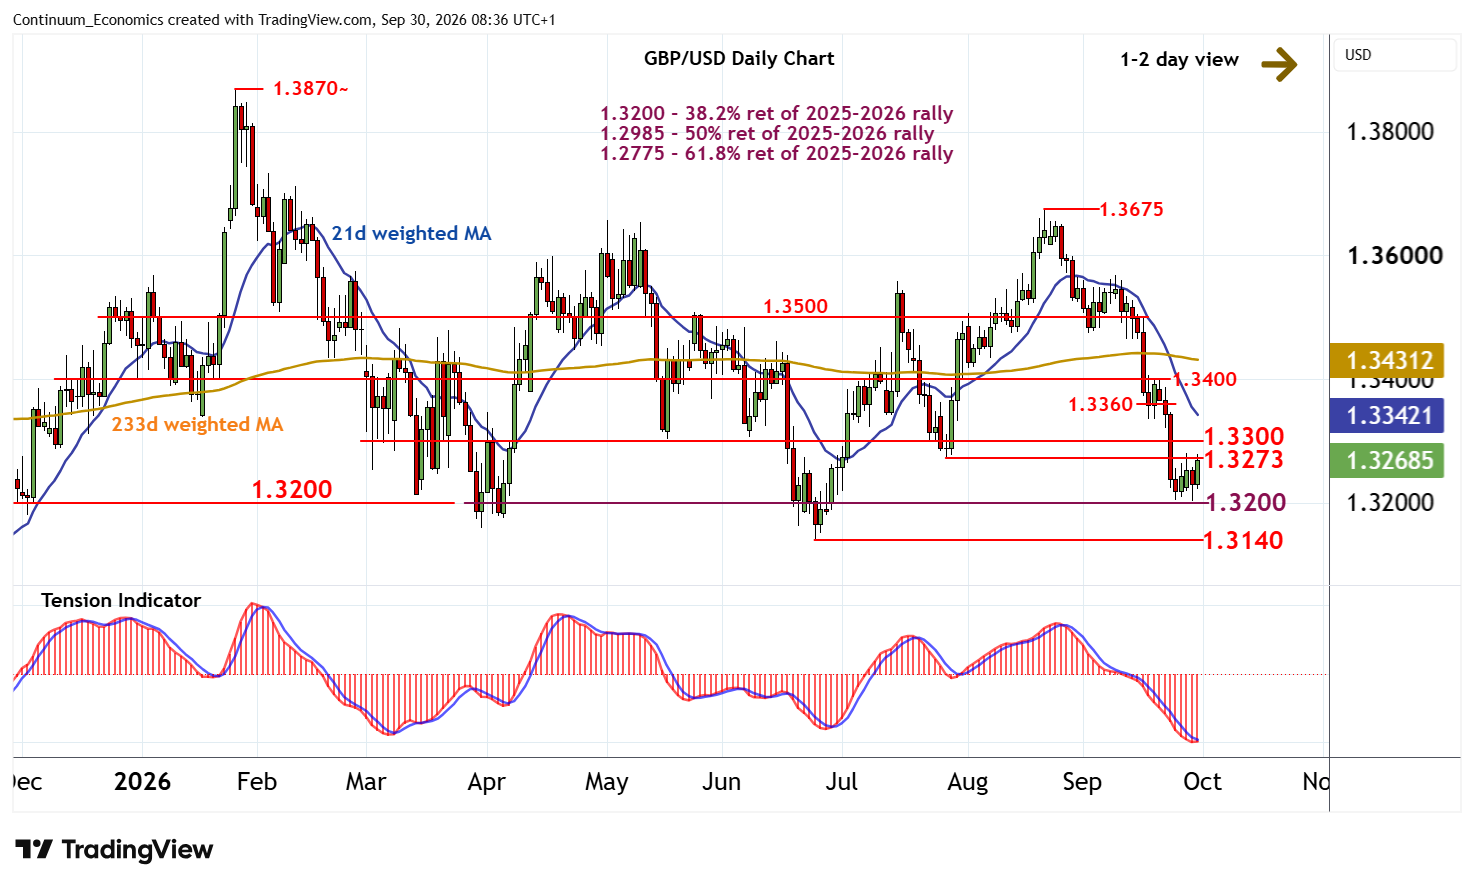
The anticipated test of support at 1.3200 has given way to a bounce
| Level | Comment | Level | Comment | |||||
|---|---|---|---|---|---|---|---|---|
| R4 | 1.3400 | ** | congestion | S1 | 1.3200 | ** | cong, 38.2% ret | |
| R3 | 1.3360 | * | range lows | S2 | 1.3140 | ** | 24 Jun YTD low | |
| R2 | 1.3300 | ** | congestion | S3 | 1.3100 | ** | congestion | |
| R1 | 1.3273 | ** | 28 Jul (w) low | S4 | 1.3000/10 | ** | cong; November 2025 low |
Asterisk denotes strength of level
08:10 BST - The anticipated test of support at 1.3200 has given way to a bounce, as intraday studies turn higher, with prices currently pressuring resistance at the 1.3273 weekly low of 28 July. Oversold daily stochastics are unwinding and the bearish daily Tension Indicator is flattening, suggesting room for a break above here towards congestion around 1.3300. However, negative weekly charts should limit any further break in renewed selling interest beneath the 1.3360 range lows.
Following cautious/corrective trade, fresh losses are looked for. A break below 1.3200 will add weight to sentiment. But a close below the 1.3140 current year low of 24 June will turn sentiment negative and confirm continuation of broad January losses.