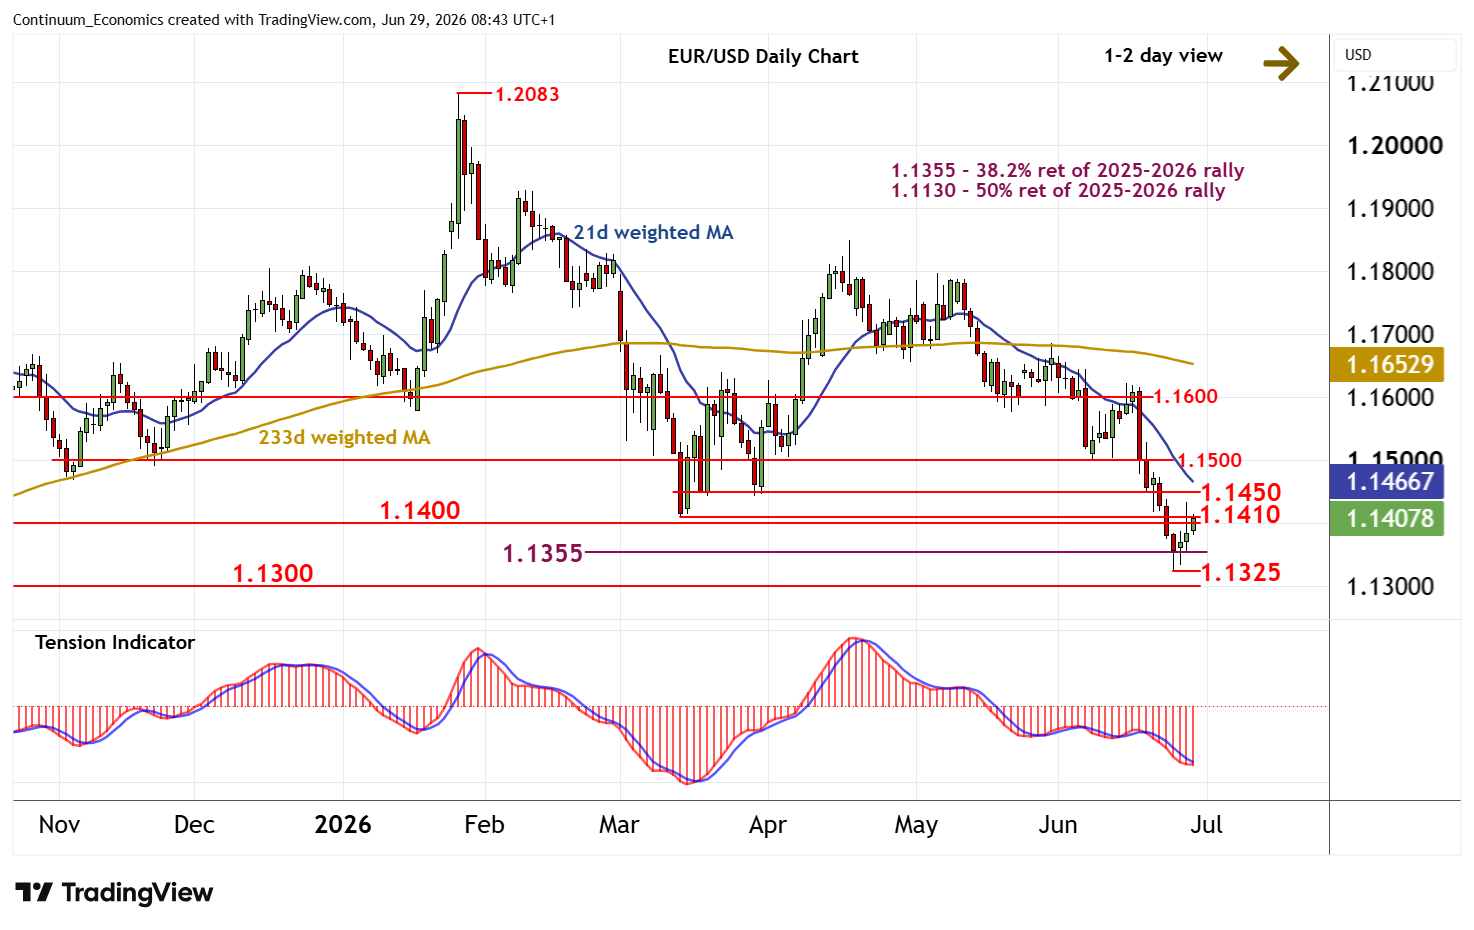
Chart EUR/USD Update: Limited tests higher
The anticipated test above resistance at congestion around 1.1400 and the 1.1410 monthly low of 13 March has been pushed back from 1.1435~
| Levels | Imp | Comment | Levels | Imp | Comment | |||
|---|---|---|---|---|---|---|---|---|
| R4 | 1.1550 | * | congestion | S1 | 1.1355 | ** | 38.2% ret of 2025-2026 rally | |
| R3 | 1.1500 | ** | congestion | S2 | 1.1325 | 24 Jun YTD low | ||
| R2 | 1.1450 | * | congestion | S3 | 1.1300 | ** | congestion | |
| R1 | 1.1400/10 | ** | congestion; 13 Mar (m) low | S4 | 1.1200 | ** | congestion |
*Asterisk denotes strength of level
08:35 BST - The anticipated test above resistance at congestion around 1.1400 and the 1.1410 monthly low of 13 March has been pushed back from 1.1435~, with prices once again trading around 1.1400/10. Oversold daily stochastics are unwinding and the bearish daily Tension Indicator is flat, suggesting room for a fresh break towards congestion around 1.1450. However, bearish weekly charts should prompt renewed selling interest towards here, and limit any further gains, if seen, to consolidation beneath further congestion around 1.1500. Following cautious/corrective trade, fresh losses are looked for. Support is at the 1.1355 Fibonacci retracement and the 1.1325 current year low of 24 June. A later break will add weight to sentiment and extend January losses initially towards congestion from March-May 2025 around 1.1300. Beneath here is further congestion around 1.1200.