Published: 2026-10-05T02:08:43.000Z
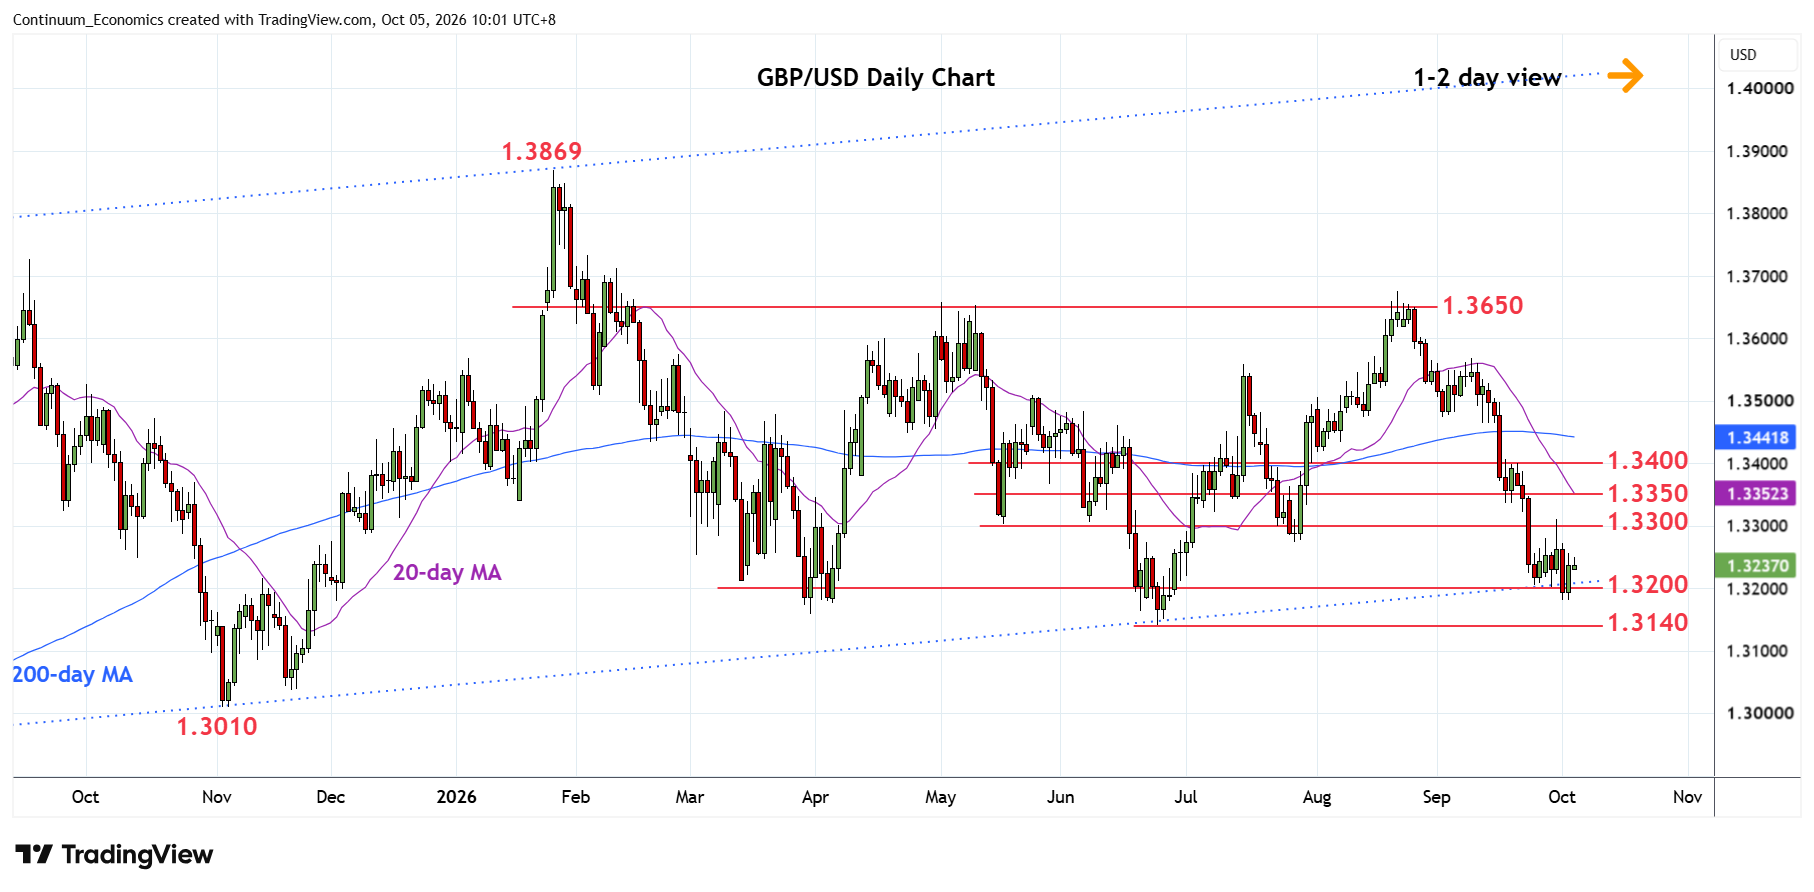
Chart GBP/USD Update: Consolidating at 1.3180 low
7
Turned up in range from the 1.3180 low of last week as prices unwind oversold intraday and daily studies
| Level | Comment | Level | Comment | |||||
|---|---|---|---|---|---|---|---|---|
| R4 | 1.3450 | * | congestion | S1 | 1.3180 | * | 1 Oct low | |
| R3 | 1.3400 | ** | congestion | S2 | 1.3140 | ** | 24 Jun YTD low | |
| R2 | 1.3350 | * | congestion | S3 | 1.3100 | * | congestion | |
| R1 | 1.3273/00 | * | 28 Jul low, congestion | S4 | 1.3010 | ** | Nov 2025 low |
Asterisk denotes strength of level
02:00 GMT - Turned up in range from the 1.3180 low of last week as prices unwind oversold intraday and daily studies. Above the 1.3250 congestion will see room for stronger bounce to resistance at the 1.3273/1.3300 congestion which is expect this to cap. Break here, will open up room for stronger recovery to retrace losses from the 1.3675 August high to 1.3350/1.3400 congestion area. Meanwhile, support at the 1.3200/1.3180 area should underpin. Falure here will expose the 1.3140 June current year low to retest.