Published: 2026-11-18T00:47:59.000Z
Chart NZD/USD Update: Consolidating at .5485/.5470 support
1
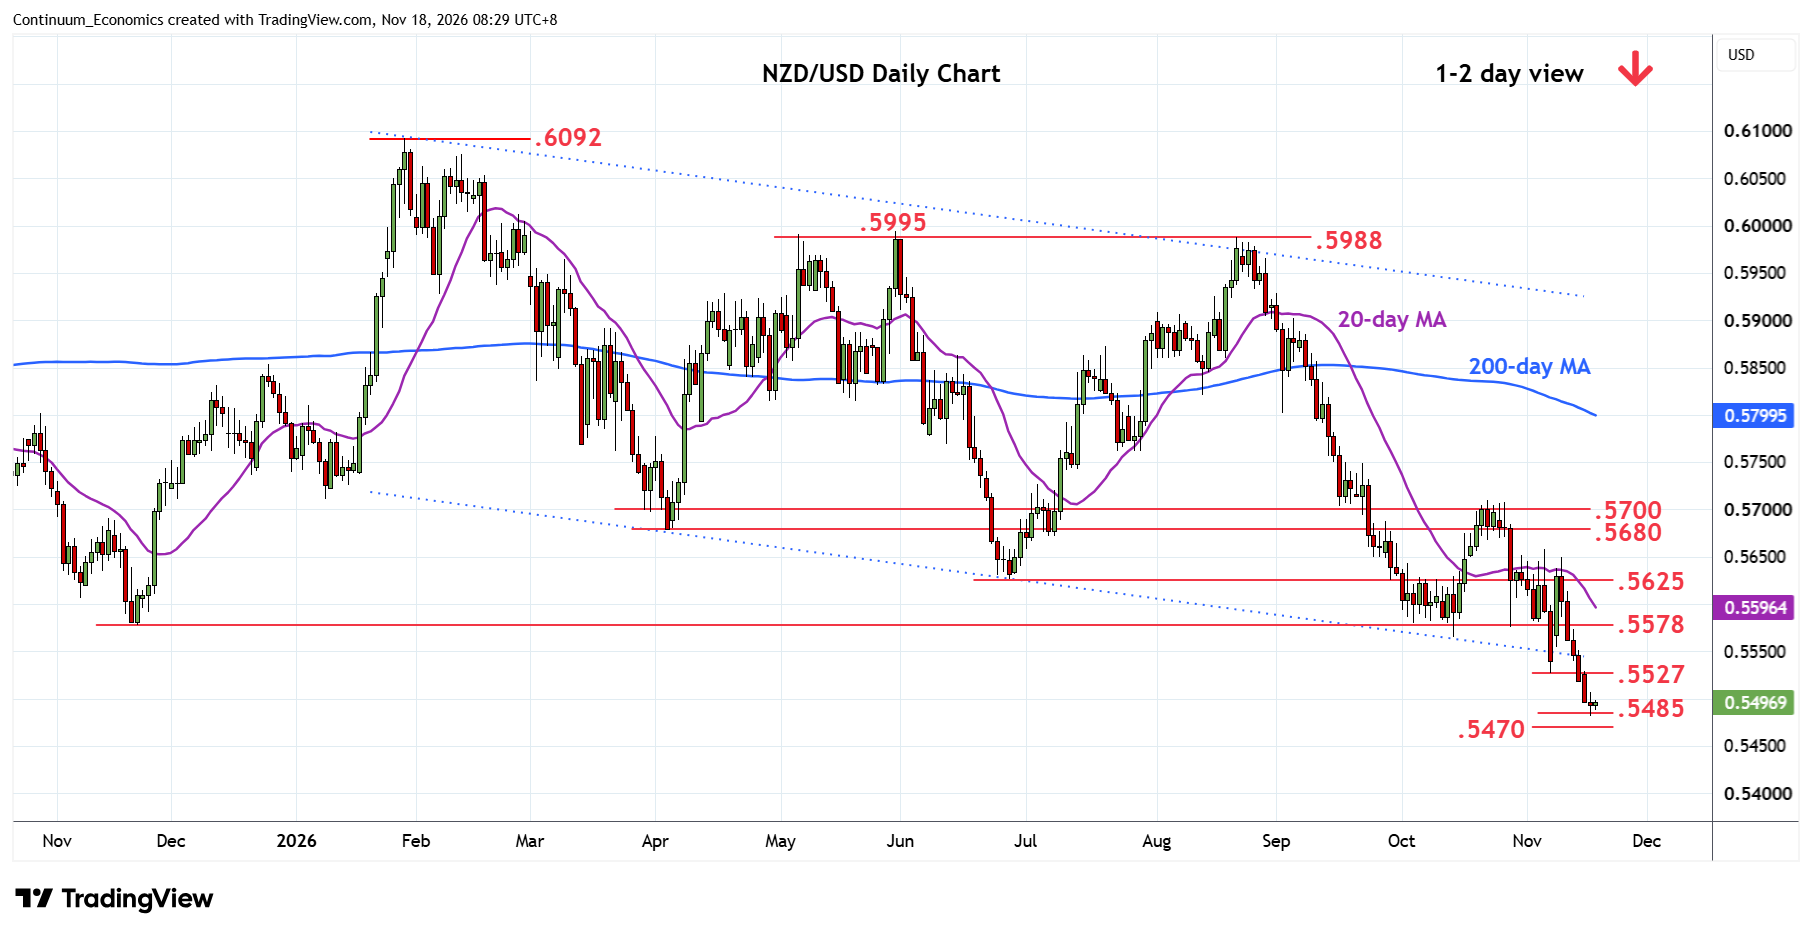
Bearish momentum finally showing signs of slowing as losses push into the critical .5485/.5470, 2025/2020 year lows
| Levels | Imp | Comment | Levels | Imp | Comment | |||
|---|---|---|---|---|---|---|---|---|
| R4 | .5680 | ** | Apr low | S1 | .5485 | ** | Apr 2025 year low | |
| R3 | .5625/50 | ** | Jun low, congestion | S2 | .5470 | ** | Mar 2020 year low | |
| R2 | .5550/78 | * | congestion, Nov 2025 low | S3 | .5400 | * | congestion | |
| R1 | .5527 | * | 6 Nov low | S4 | .5350 | * | congestion |
Asterisk denotes strength of level
00:40 GMT - Bearish momentum finally showing signs of slowing as losses push into the critical .5485/.5470, 2025/2020 year lows. Intraday studies and daily studies are unwinding oversold readings suggesting consolidation above these lows. However, bearish weekly studies threatens further losses ahead. Break, if seen, will see room to the .5400/.5350 congestion area. Meanwhile, resistance starts at the .5527 low of 6 November. Above here will open up room for stronger bounce to the .5550/78 congestion and November 2025 low.