Chart EUR/USD Update: Balanced beneath resistance - background studies rising
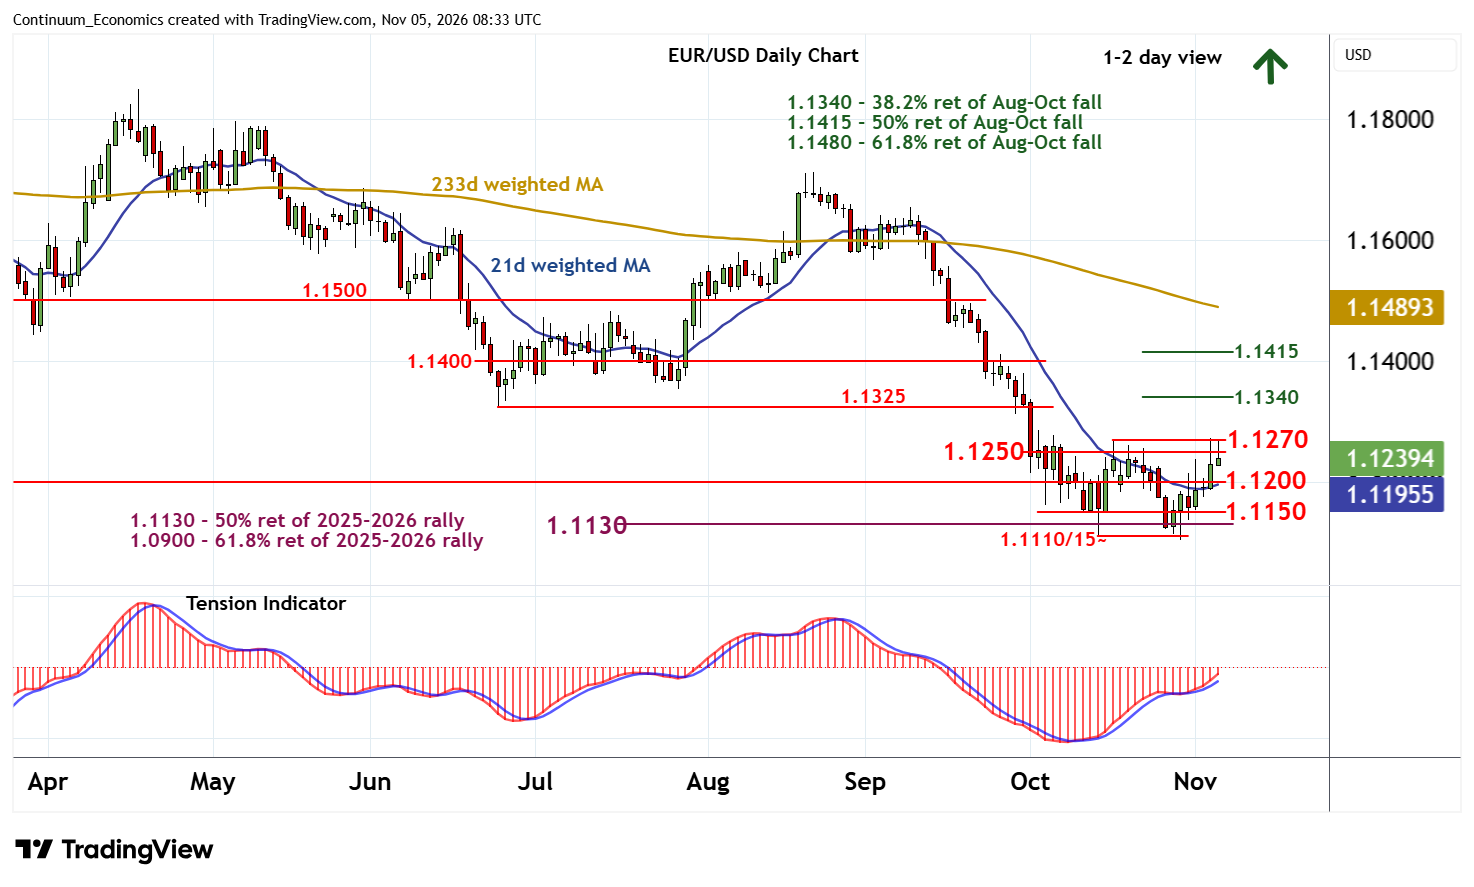
Little change, as the retest of resistance within congestion around 1.1250 and the 1.1270 weekly high of 16 October gives way to further choppy trade beneath here
| Levels | Imp | Comment | Levels | Imp | Comment | |||
|---|---|---|---|---|---|---|---|---|
| R4 | 1.1340 | ** | 38.2% ret of Oct-Aug fall | S1 | 1.1200 | ** | break level | |
| R3 | 1.1325 | ** | 24 Jun (m) low | S2 | 1.1150 | congestion | ||
| R2 | 1.1270 | ** | 16 Oct (w) high | S3 | 1.1130 | ** | 50% ret of 2025-2026 rally | |
| R1 | 1.1250 | congestion tops | S4 | 1.1110/15 | ** | 14-29 Oct YTD low |
*Asterisk denotes strength of level
08:30 GMT - Little change, as the retest of resistance within congestion around 1.1250 and the 1.1270 weekly high of 16 October gives way to further choppy trade beneath here. Daily readings are positive and oversold weekly stochastics are ticking higher, suggesting an improvement in sentiment and room for further gains in the coming sessions. A later break above here will improve sentiment and extend mid-October gains initially to the 1.1325 monthly high of 24 June. Just beyond here is the 1.1340 Fibonacci retracement. But already overbought daily stochastics and the bearish weekly Tension Indicator should limit any initial tests of this range in profit-taking/consolidation.
Meanwhile, support remains at 1.1200. A close back beneath here, if seen, will stabilise price action and prompt fresh consolidation above the 1.1130 Fibonacci retracement and congestion around 1.1150.