Weekly Chart AUD/USD: Extending losses
Break of the .6900 level has seen losses through the .6865/.6833 June and March lows to confirm a 10-month top pattern at the .7278, May current year high
Break of the .6900 level has seen losses through the .6865/.6833 June and March lows to confirm a 10-month top pattern at the .7278, May current year high.
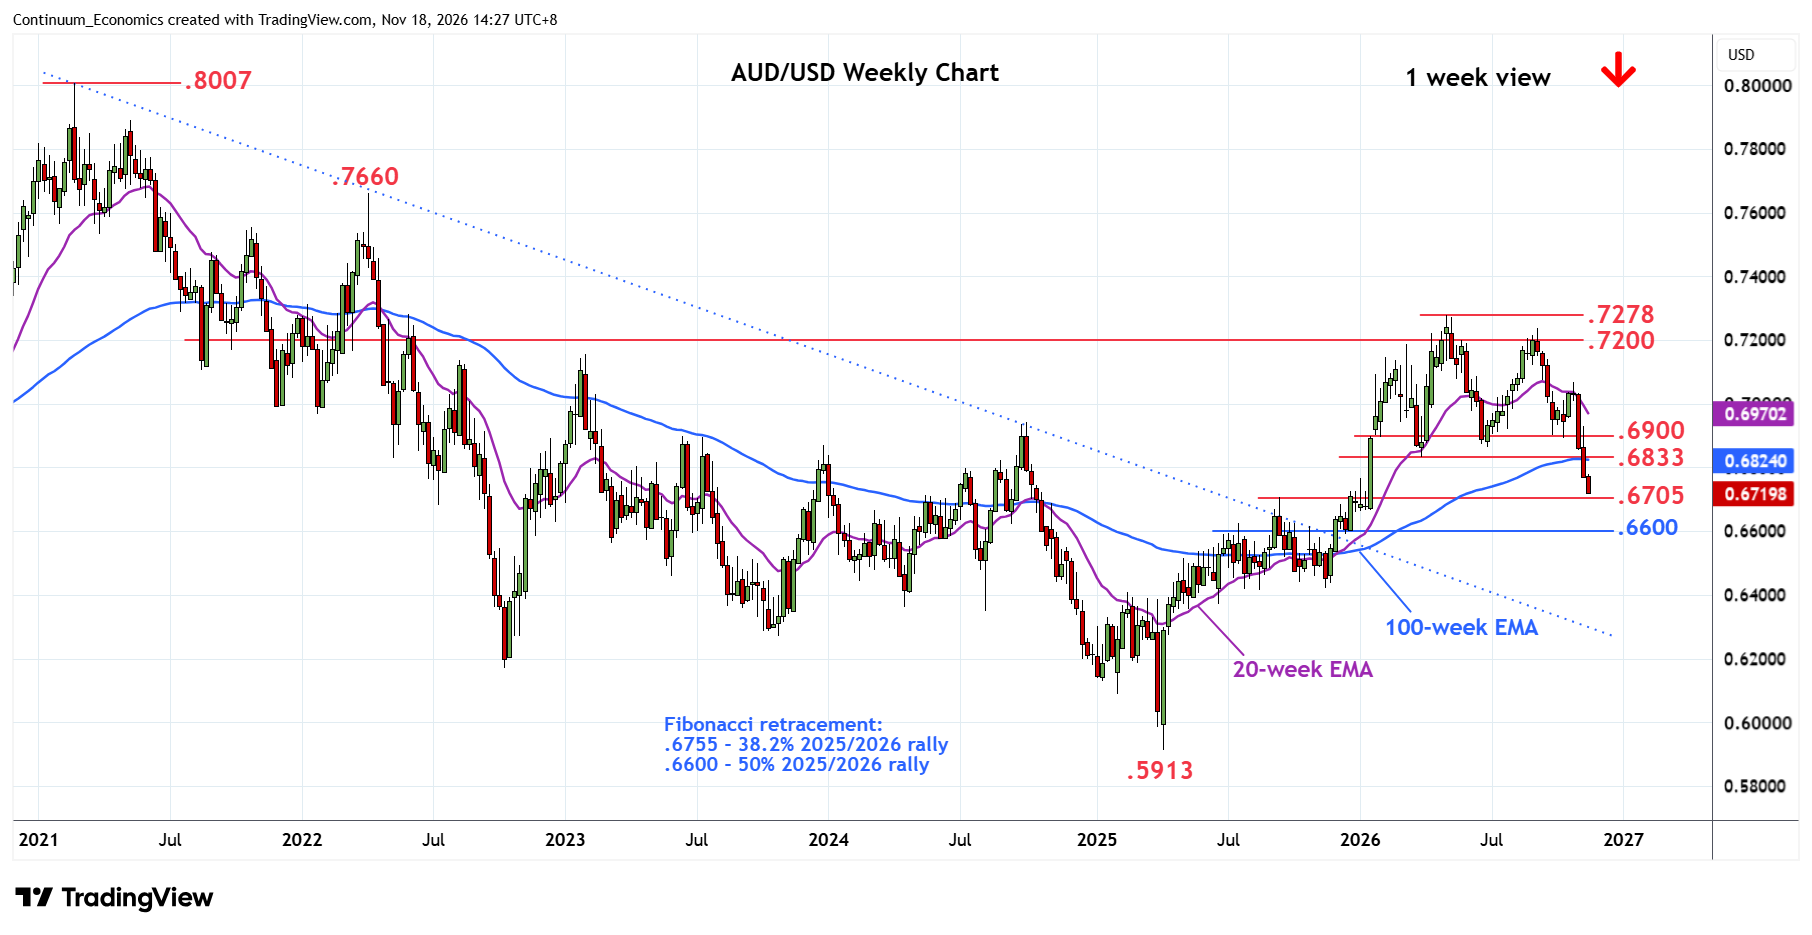
Bearish momentum from the .7068 October high keep pressure on the downside and see room to the nearby support at .6705, September 2025 high. Break here will see room for deeper pullback to retrace the 2025/2026 rally to .6600 congestion and 50% Fibonacci level. The latter also marks bullish break in December of the previous trendline from the 2021 year high which now turns support and where reaction can be expected.
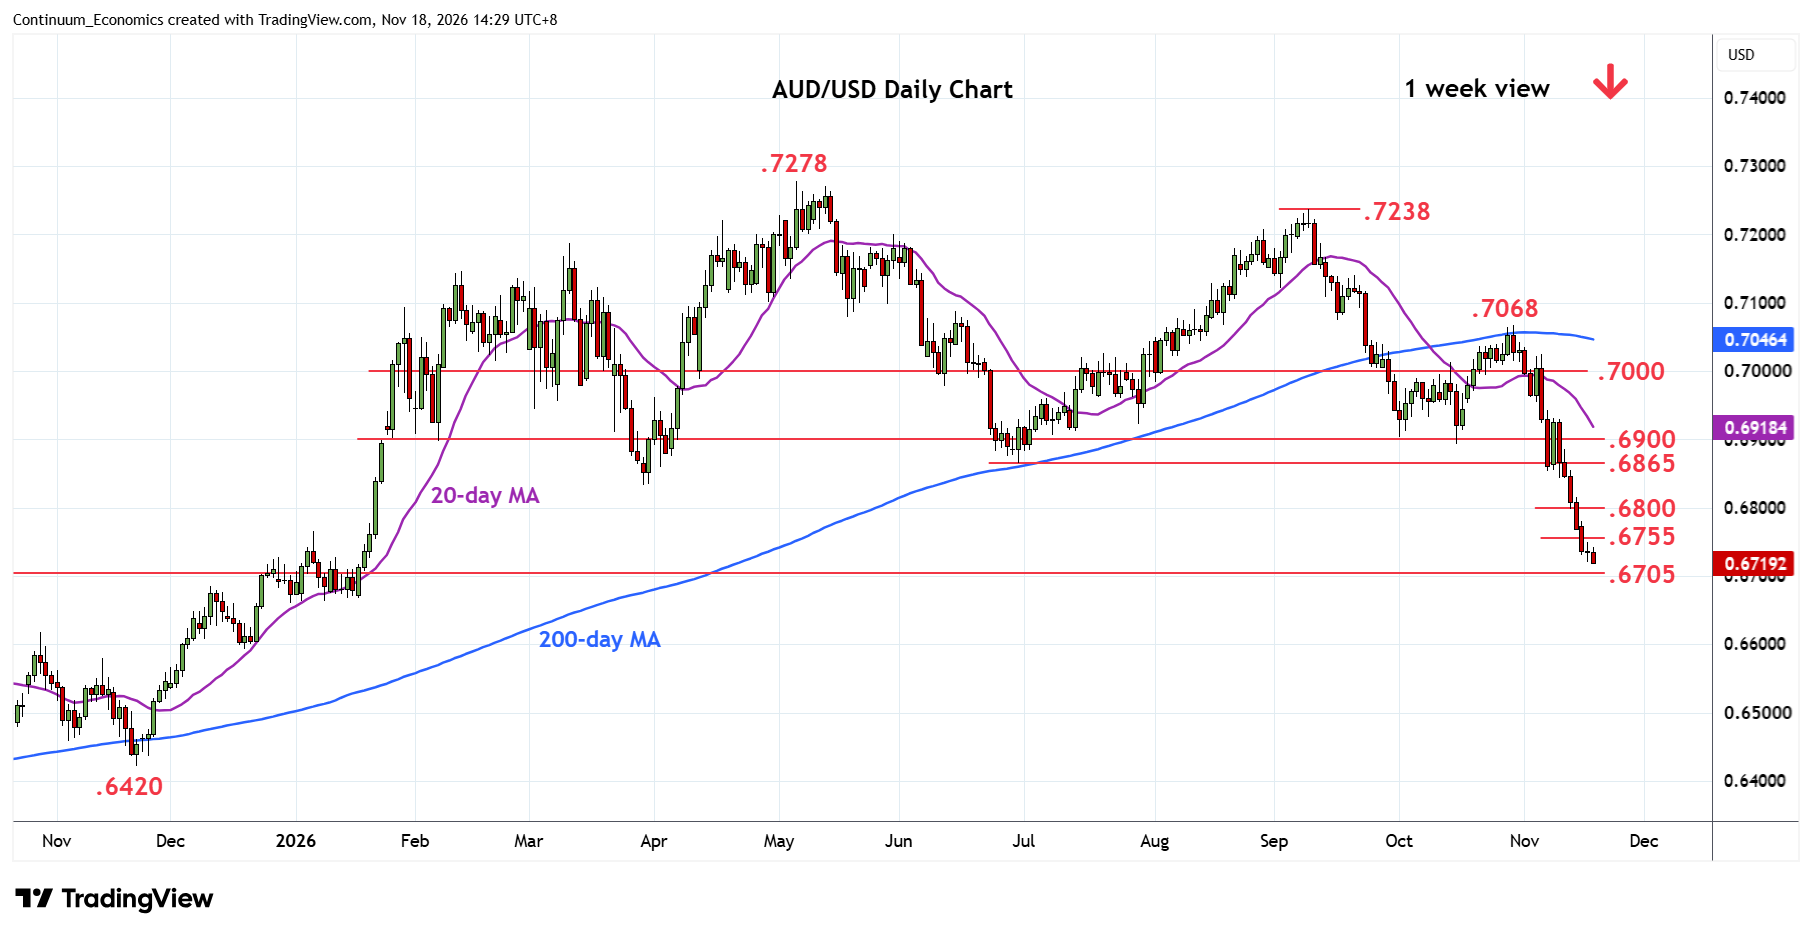
Meanwhile, resistance is lowered to the .6750/.6800 congestion area. Above here will ease the downside pressure and clear the way for stronger bounce to strong resistance at the .6865/.6900, June and October lows. Would need to clear these to fade the downside pressure and open up room for stronger recovery to the .7000 level and .7068, October high.