Published: 2026-09-09T00:22:15.000Z
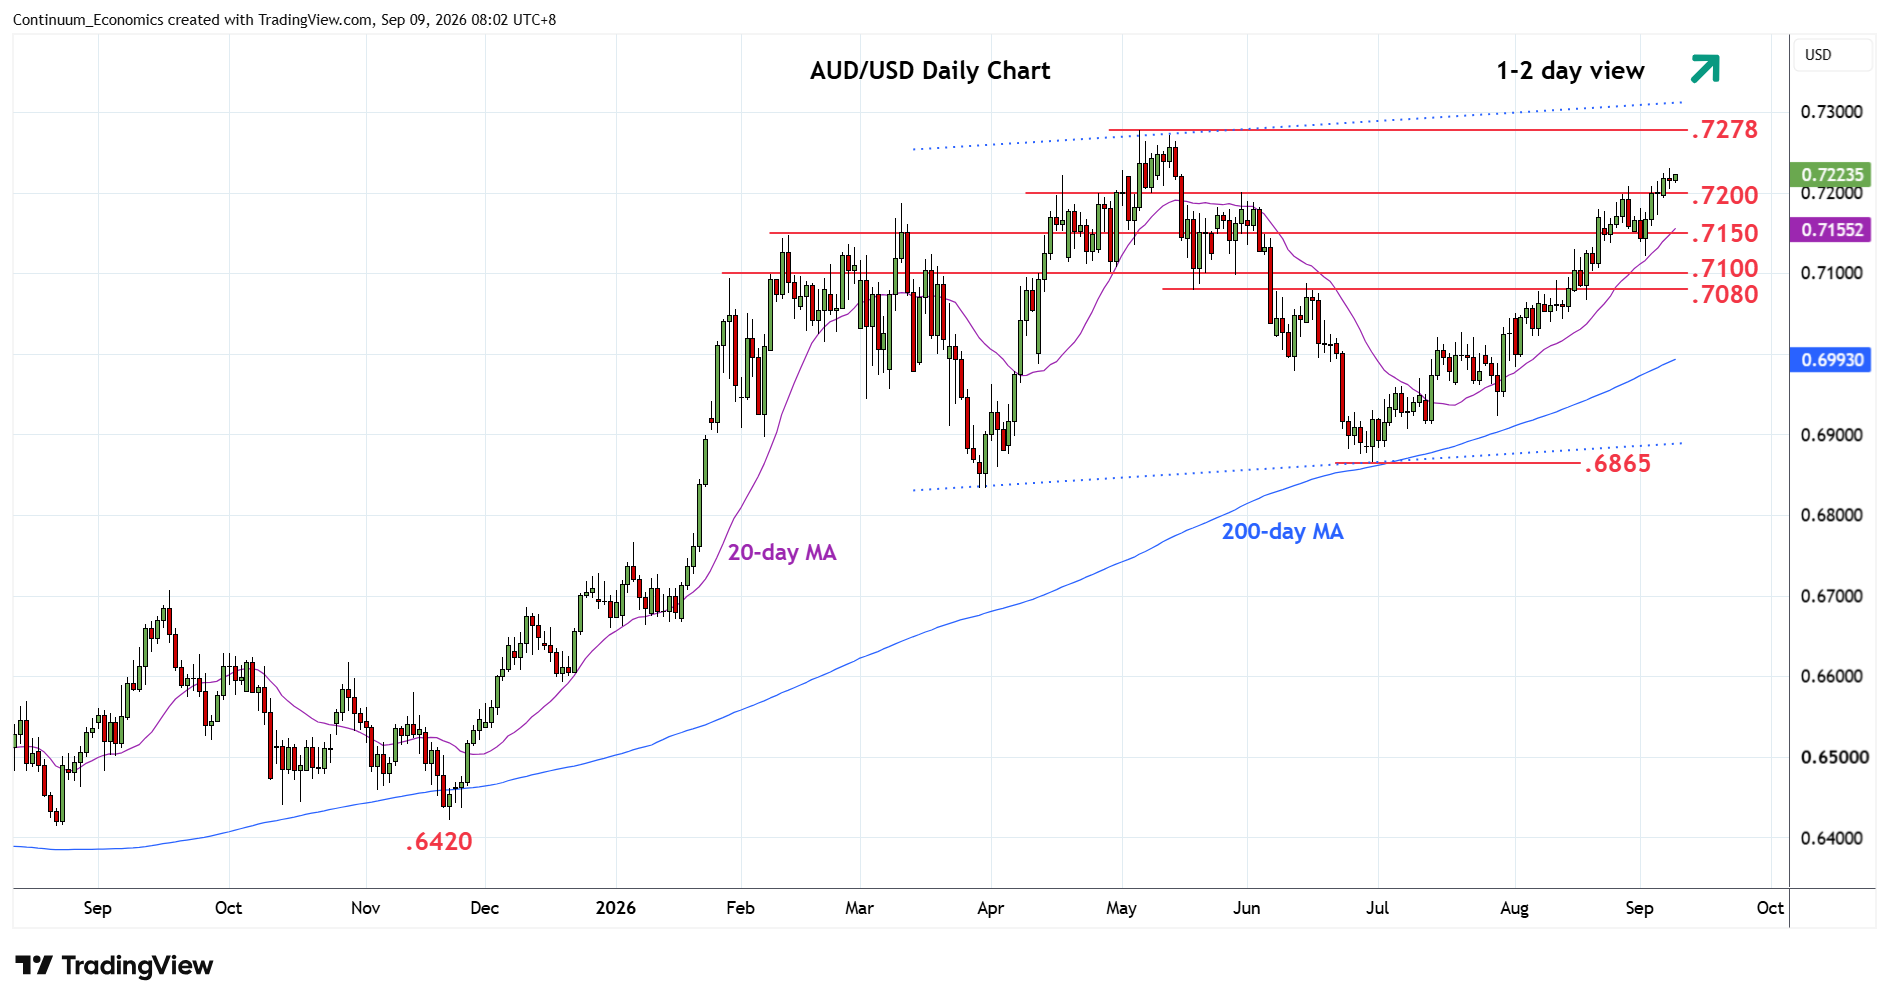
Chart AUD/USD Update: Edging towards .7278, May high
2
Stays above the .7200 level as prices extend gains from the June low to reach .7230 high
| Levels | Imp | Comment | Levels | Imp | Comment | |||
|---|---|---|---|---|---|---|---|---|
| R4 | 0.7400 | * | congestion | S1 | 0.7200 | * | congestion | |
| R3 | 0.7300 | * | congestion | S2 | 0.7150 | * | congestion | |
| R2 | 0.7278 | ** | 6 May YTD high | S3 | 0.7121 | ** | 2 Sep low | |
| R1 | 0.7230 | 8 Sep high | S4 | 0.7100 | ** | congestion |
Asterisk denotes strength of level
00:15 GMT - Stays above the .7200 level as prices extend gains from the June low to reach .7230 high. Positive daily and weekly studies keep pressure on the upside but overbought readings suggest reaction on retest of the .7278 May high can be expected. A later break here will extend the bullish gains from the April 2025 low and further retrace losses from the 2021 year high. Meanwhile, support is raised to the .7200 level. Below here will ease the upside pressure and see room for corrective pullback to support at the .7150/.7121 congestion and low of last week.