Published: 2026-06-26T07:14:13.000Z
Chart EUR/AUD Update: Extending corrective gains
-
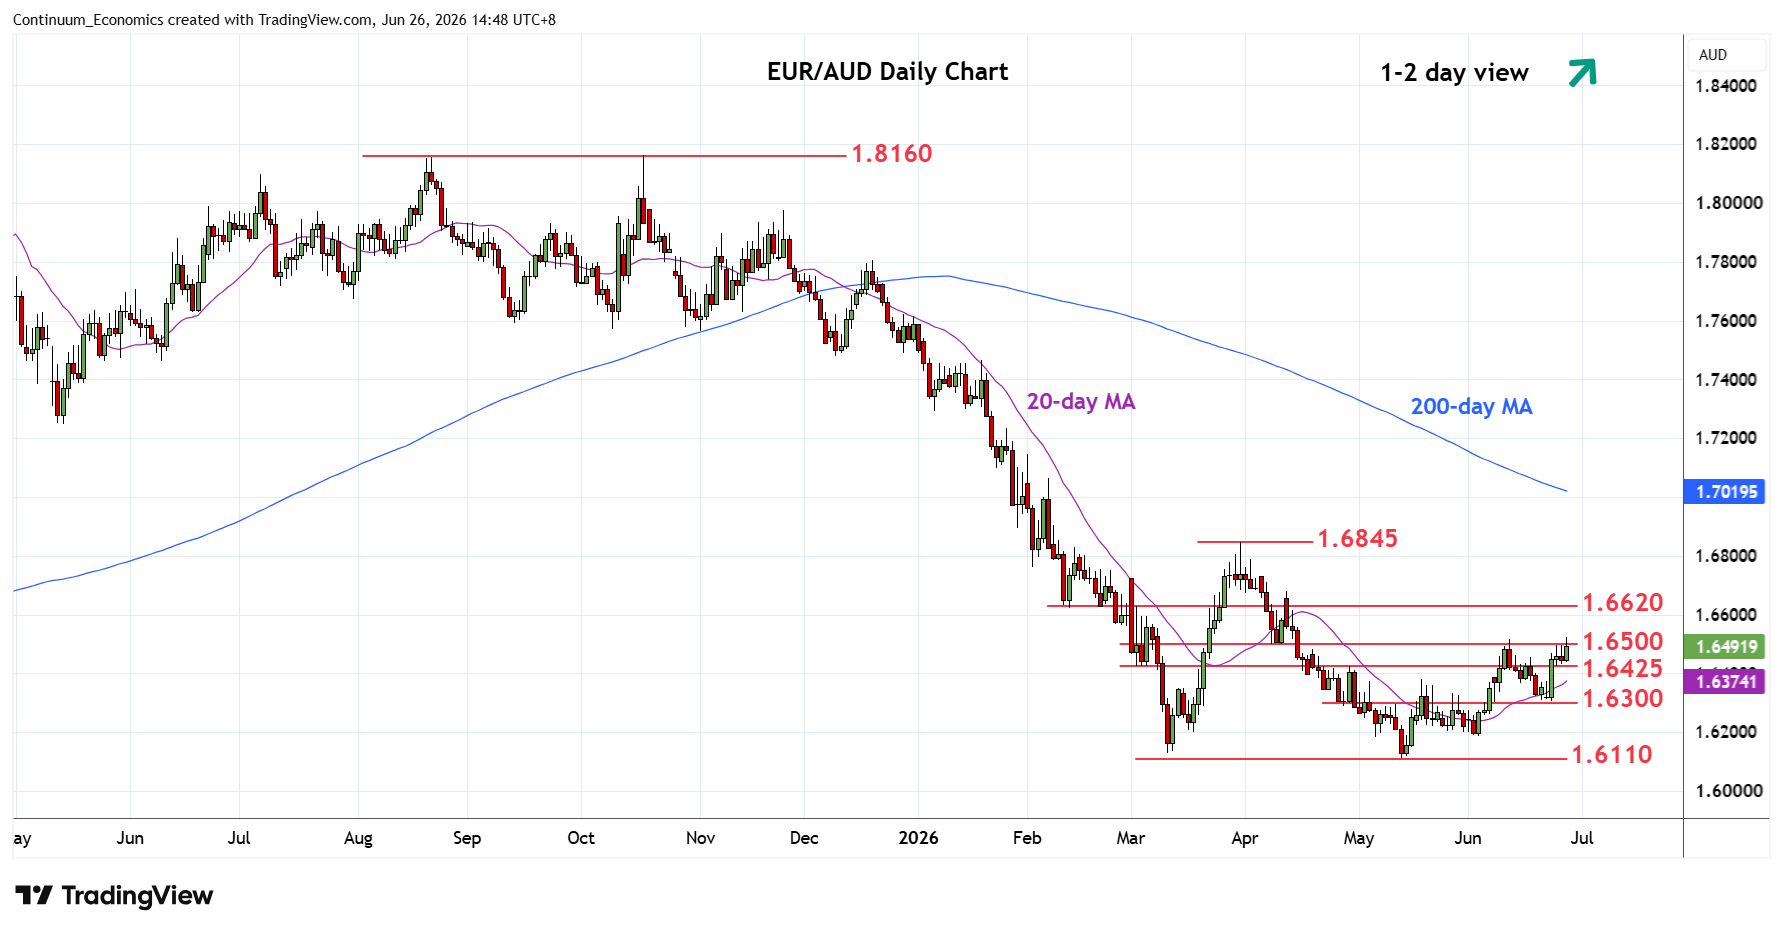
Pressuring the 1.6500 level and break here will extend the broader gains from 1.6110 May current year low
| Levels | Imp | Comment | Levels | Imp | Comment | |||
|---|---|---|---|---|---|---|---|---|
| R4 | 1.6800/45 | ** | congestion, Mar high | S1 | 1.6425 | * | congestion | |
| R3 | 1.6680 | 13 Apr high | S2 | 1.6300 | ** | congestion | ||
| R2 | 1.6600/20 | * | congestion | S3 | 1.6200 | * | congestion | |
| R1 | 1.6500 | ** | congestion, 8 Apr low | S4 | 1.6130/10 | ** | Mar, 13 May YTD lows |
Asterisk denotes strength of level
07:15 GMT - Pressuring the 1.6500 level and break here will extend the broader gains from 1.6110 May current year low. Positive daily and weekly studies suggest scope for break here further retrace the March/May losses and see room to resistance at 1.6600/20 congestion. Clearance here will open up room for the 1.6800 congestion and 1.6845 March high. Meanwhile, support at the 1.6425 underpin. Only below here will see room for pullback to the 1.6300 congestion. Would take break here to return focus to the downside for retest of 1.6200 congestion then the 1.6130/10 March/May lows.