Published: 2026-07-09T07:35:11.000Z
Chart AUD/JPY Update: Extend bounce from 111.30 low
2
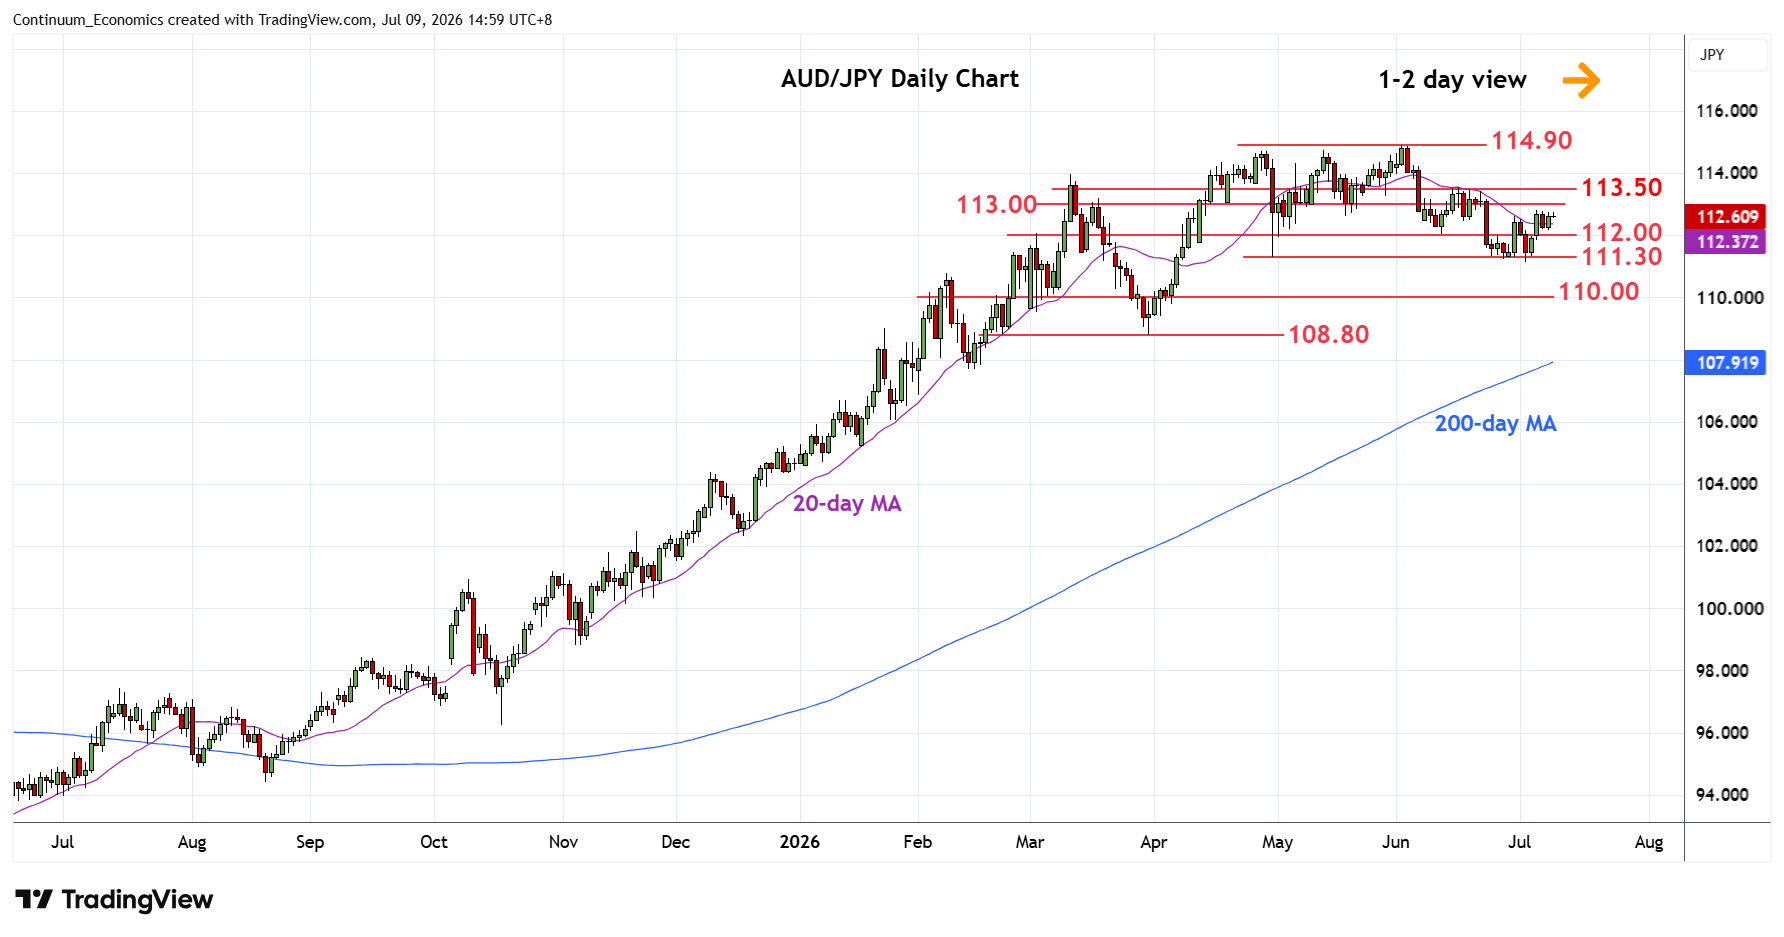
Break above resistance at the 112.00/50 area see prices extending bounce from the 111.30 support to reach 112.80 high
| Levels | Imp | Comment | Levels | Imp | Comment | |||
|---|---|---|---|---|---|---|---|---|
| R4 | 114.90 | ** | 2 Jun YTD high | S1 | 112.00 | * | congestion | |
| R3 | 114.00 | * | congestion | S2 | 111.30 | ** | 30 Apr low | |
| R2 | 113.50 | ** | 15 Jun high | S3 | 110.80 | * | 9 Feb high | |
| R1 | 113.00 | * | congestion | S4 | 110.00 | * | congestion |
Asterisk denotes strength of level
07:30 GMT - Break above resistance at the 112.00/50 area see prices extending bounce from the 111.30 support to reach 112.80 high. Break here and the 113.00 level will see room for extension to strong resistance at the 113.50 mid-June high which is expected to cap. Clearance, but not expected, will return focus to the 114.90 June current year high. Meanwhile, support is raised to 112.00 level from the 111.30 low. Would take break of these to extend the June losses and see room to support at the 110.80/110.00 area and 108.80 March low.